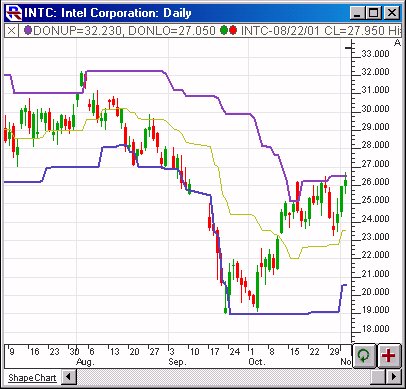
Donchian Channels were introduced by Richard Donchian, a pioneer in the field of trend following. The Donchian Channel is a simple trend following breakout...

The Double Top RTX extension identifies double tops and bottoms and extends the lines until they are taken out by a future bar. User parameters control...
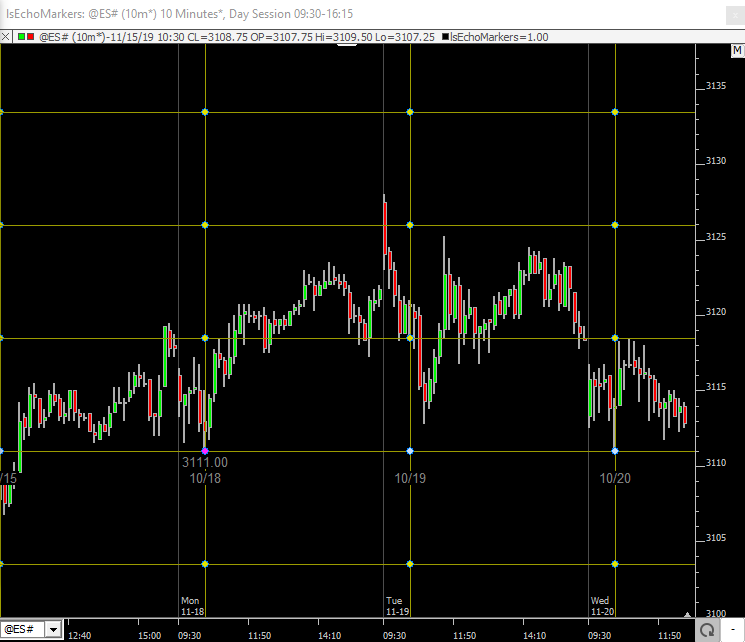
EchoMarkers is an RTX drawing tool for placing markers at any position (price and time) in a chart with optional echoes of the marker at the same price and...
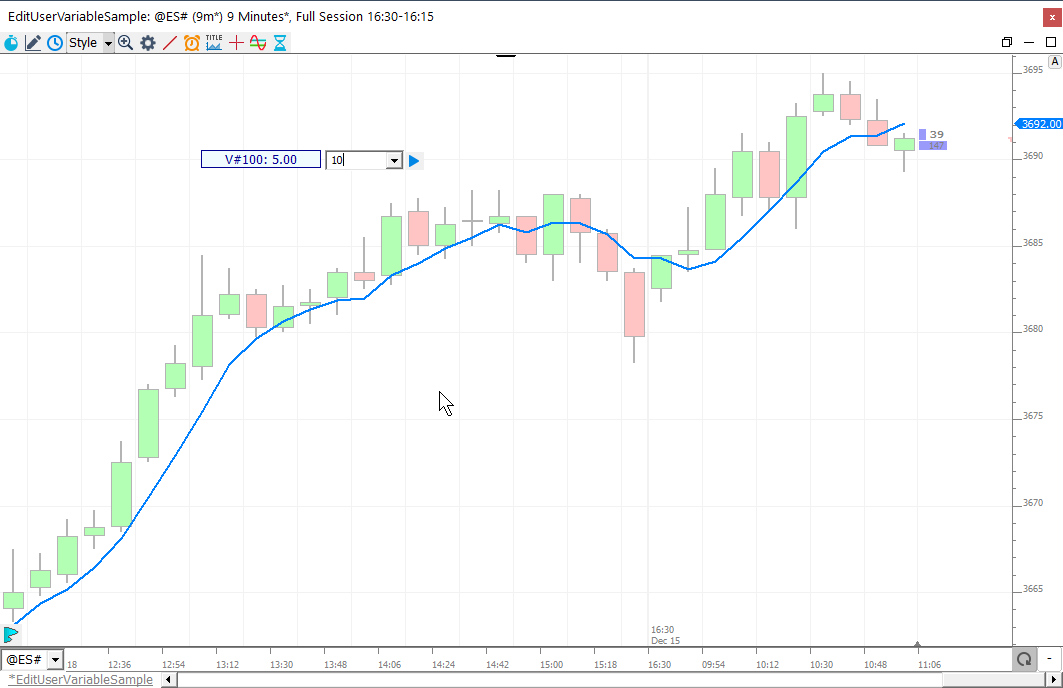
The EditUserVariable RTX Extension is a tool designed to facilitate changing the value of a V#, C#, or T# user variable. Chart buttons, setup with purpose Set...
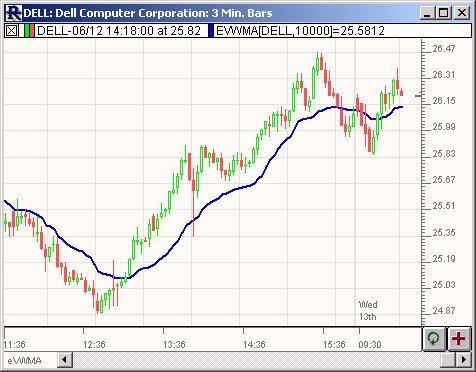
eVWMA is a statistical measure using the volume to define the period of the moving average. It incorporates volume information in a natural and logical way....
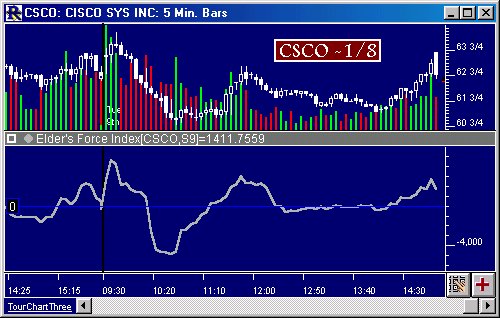
The Elder's Force Index uses volume and price change from previous close to determine the momentum behind a price move in a given direction. An increasing...
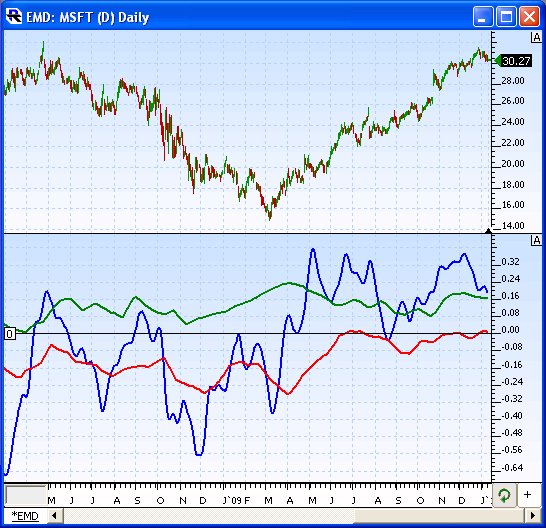
The Empirical Mode Decomposition Indicator (EMD) helps identify whether a market is in a cycle or trend mode. This indicator is discussed in the article titled...
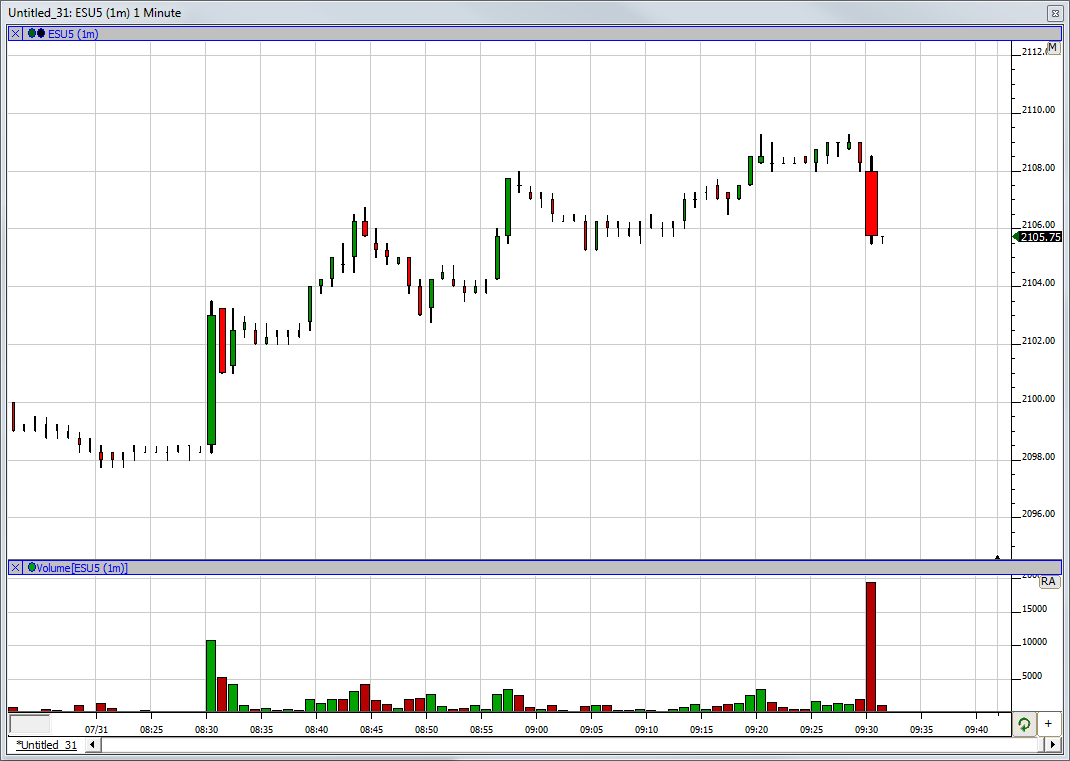
The Equi-Indicator creates price bars with a width based on the Indicator specified in the preferences. The most common use of the Equi-Indicator is to create...
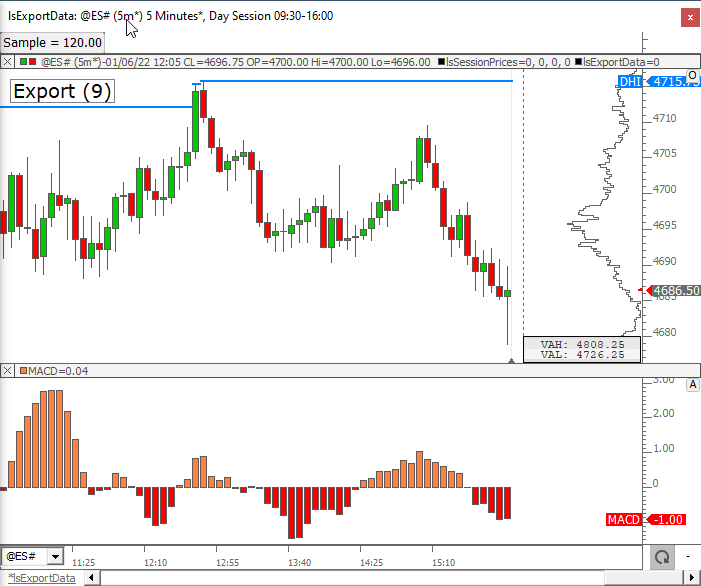
The ExportData extension is designed to allow the user to dynamically export key prices and other data to a .csv/Excel file. ExportData can export any User...
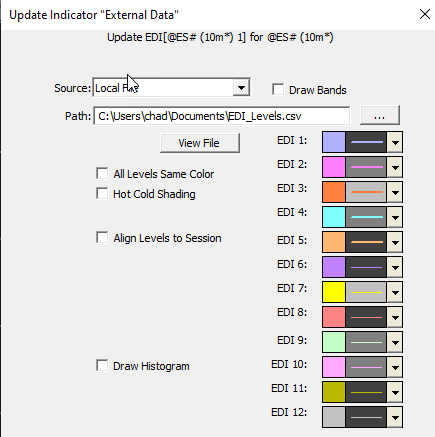
The External Data Indicator (EDI) allows users to import custom daily support and resistance levels from csv or text files. These files may be local or on a...
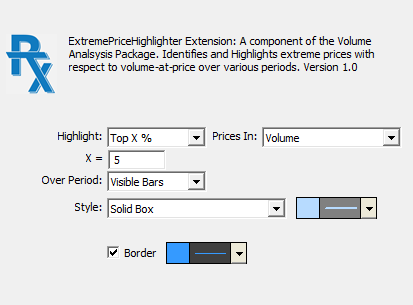
ExtremePriceHighlighter (EPH) RTX Extension requires the Volume Analysis Package and complements the order flow analysis of the VolumeScope® Package....
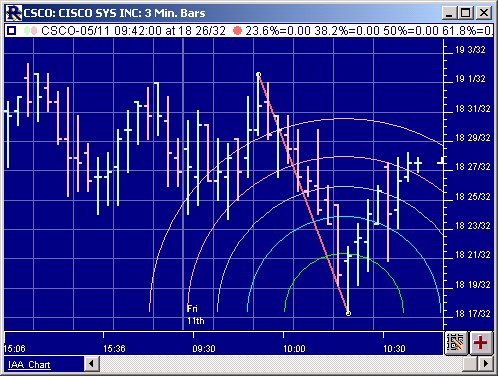
Fibonacci Arcs are displayed by first drawing a trendline between two extreme points, for example, a trough and opposing peak The arcs are drawn, centered on...