External Data Indicator

The External Data Indicator (EDI) allows users to import custom daily support and resistance levels from csv or text files. These files may be local or on a remote web server. Up to 12 levels may be imported for each instance of EDI. This video demonstrates how to properly format the csv or text file. The ability to share a file from a web server allows a single user or educator to share his levels automatically with a large group of users.

See also

The Export Data (RTX) extension allows the user to dynamically export key prices and other data to a .csv/Excel file.

Presentation

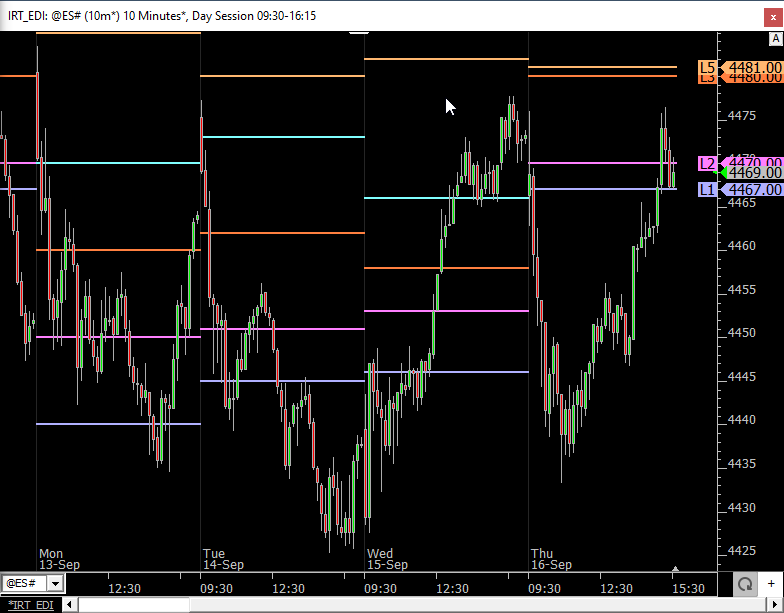
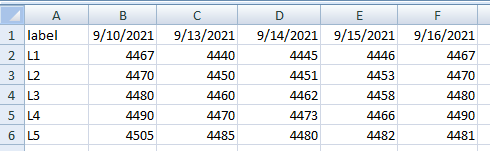
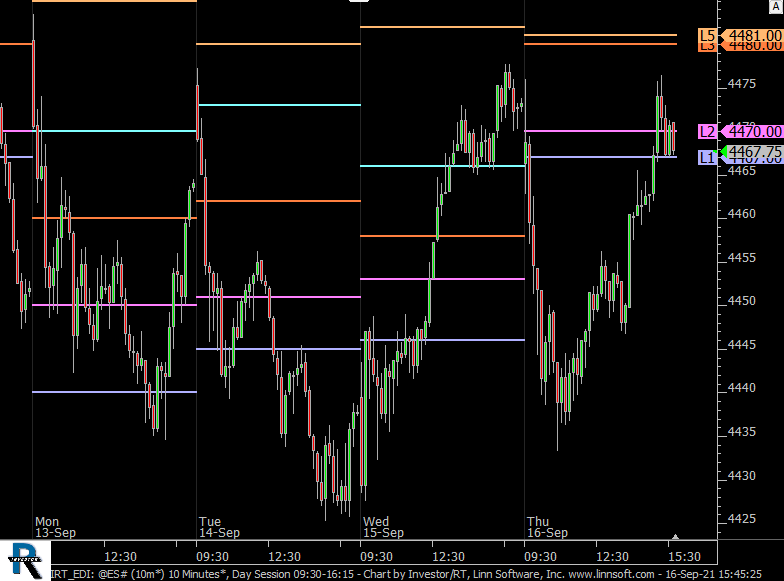
The chart above is a 10-minute chart of ES with one instance of EDI plotting 5 daily levels daily and pulling from the csv file shown below...

Formula

  • Source - Choices include ToTheTick.com Power Zones, Prediction Points, Local File, Web File, EminiPlayer Zones
  • Draw Bands - When checked, a band will be drawn between each successive level of prices in the .csv file.
  • Path - Local or Remote path tothe file used to feed EDI.
  • All Levels Same Color - Check this option for all levels to use the same color and style.
  • Hot Cold Shading - Will paint each bars color intensity based on the proximity of the closing price to that level on each bar.
  • Align Levels to Session - When checked, the levels will step on the close/open of each session as opposed to midnight on that each date.
  • Draw Histogram - Drawns each level as a histogram instead of a stepped line.
IRT EDI (@ES#)
External Data Indicator. This chart was uploaded by Investor/RT 15.1.1 showing symbol: @ES#.

Read more Download

Pop-up Video Description View
External Data Indicator - Importing Custom Levels

This video demonstrates how to import custom daily support and resistance levels from csv or...

 Watch