Price Statistics

Price Statistics requires the Volume Analysis Package.

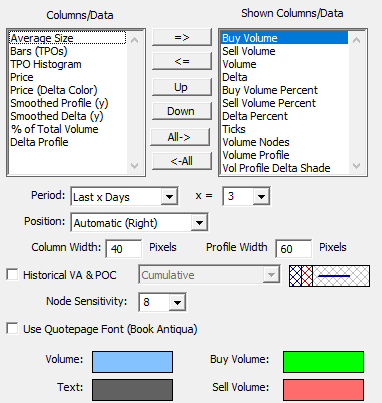
This indicator presents cumulative volume based information for each price over a user-specified period of time expressed in days or bar count.  Data items include Buy Volume, Sell Volume, Volume, Buy Volume Percent, Sell Volume Percent, Ticks, Average Size, Delta, Delta %, Price (Delta Color), Bars (TPOs), TPO Histogram, Volume Profile, Volume Profile Delta Shaded, Smoothed Profile, Smoothed Delta, % of Total Volume, Delta Profile, and Volume Nodes.  Any or all data columns may be displayed in any desired order. Each data item is color shaded based on its relative value. Custom colors are available for buy volume, sell volume, volume, and text.  Optonally, the font and style of quotepages is used display the price statistics. Specify the font using File > Preferences > Quotepage Defaults. There is also an option to plot the historical Value Area (VA) and Point of Control (POC) for various periods. View the Preferences tab for more information on each data item.

Presentation

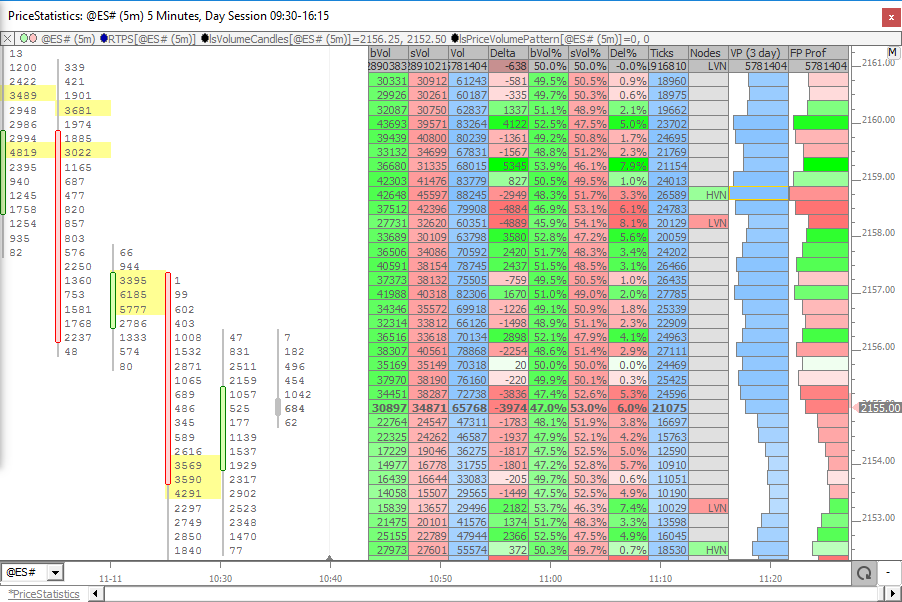
The chart above displays the Price Stastistics Indicator on the right side of the chart.  Volume at each price within each bar is displayed using the Volume Candles (RTX) indicator, along with the Price Volume Pattern indicator highlighting high volume prices in yellow.

The Price Statistics preference window below can be accessed by double-clicking anywhere on the Price Statistics indicator within the chart.

Price Statistics Preferences

Data Items / Columns Available

  • Buy Volume - volume that occurred at the ask price at each price.  It is cumulative for the entire row.
  • Sell Volume - volume that occurred on the bid price at each price. It is cumulative for the entire row.
  • Volume - total volume that occurred at each price. It is cumulative for the entire row.
  • Delta - cumulative (net) delta for the entire row.  It is cumulative for the entire row.
  • Delta % - percentage of volume that had a net positive or negative delta.  It is essentially showing a ratio of bid traded volume versus ask traded volume but only showing the % of volume that occurred on the most dominant side of the market.  It is cumulative for the entire row.
  • Buy Volume Percent - volume that occurred at the ask price at each price and displays it in the percentage form of total volume.  It is cumulative for the entire row.
  • Sell Volume Percent - volume that occurred at the bid price at each price and displays it in the percentage form of total volume.  It is cumulative for the entire row.
  • Ticks - amount of ticks at each price.  Essentially, volume is discarded and only the ticks are counted.  It is cumulative for the entire row.
  • Average Size - average volume size per trade at each price.  It is cumulative for the entire row.
  • Price (Delta Color) - price of each trade with the background shaded according to the intensity of the delta.
  • Price - price of each trade.  It is included for easy reference.
  • Bars (TPOs) - amount of time periods that have been spent at each price.  It is dependent on the chart's periodicity.
  • TPO Histogram - graphic form the amount of time periods that have been spent at each price.  It is dependent on the chart's periodicity.
  • Volume Profile - distribution of volume at price.
  • Volume Profile Delta Shaded - distribution of volume at price and shades each volume at price bar according to the intensity of delta.
  • Smoothed Profile (y) - Averages the volume over the nearest (y) bars. For instance if set to 11, the volume for the nearest 11 prices will be averaged together. This creates the effect of a smooth profile.
  • Smoothed Delta (y) - Averages the delta for the nearest (y) bars and displays it as a value.
  • % of Total Volume  - percentage of volume traded at each specific price.
  • Pullback Data - shows the action since the last price extreme of current bar was achieved. To view Pullback Data, choose Pullback Data from the Period list.  Set Horizonta Positon to "Automatic (right)".
  • Period - sets the length (time period) of the statistics under review.
  • Horizontal Position - Position of Price Statistics within chart.  Choices are Automatic, Automatic (Right), Offset from Left, Offset from Right. Offset is specified in pixels.  The Automatic choice will align to the left edge of the chart.
  • Column Width - Width of each column.
  • Profile Width - Width of each profile.
  • Historical VA and POC - displays the developing Value Area and Point of Control.
  • Use Quotepage Font - When checked, the font specified in Setup: Preferences: Quotepage Defaults will be used to display the Bar Statistics Text.
No examples. Let us know if you'd like to see one added.
No videos. Let us know if you'd like to see one added.