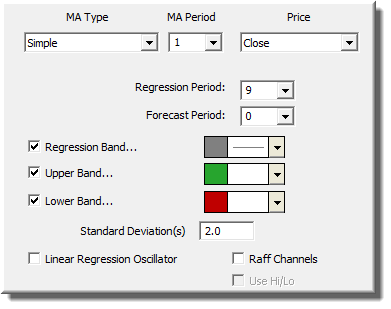
The Linear Regression Forecast indicators performs regression analysis on optionally smoothed price data, forecasts the regression lines if desired, and creates standard deviation bands above and below the regression line. First, the data, based on the price selected, is smoothed using the moving average period and type. If you prefer no smoothing, choose a period of 1. The resulting data is used to form regression lines ending at each bar, using the regression period specified. The values at each bar can optionally be forecasted values, determined by projecting the regression lines X bars into the future, X being the forecast period. If X=0, then no forecasting will occur. Standard deviation bands can then be drawn above and below the regression line, based on a number of standard deviations (standard deviation multiple) specified, and a standard deviation value computed using data in the the regression period range.
The name of this indicator understates its capabilities; forecasting is optional and is but a small part of what this indicator can do. In its most basic form, with no smoothing (period of 1) and no forecasting (forecast period of 0), LRF simply gives the ending point of linear regression lines ending at each bar using the regression period provided. These settings produce a moving average identical to the Least Squares moving average type available in Investor/RT (add both to your chart and see).
A smoothing period causes the data to be pre-smoothed prior to performing regression analysis or forecasting. A forecast period takes the linear regression line ending at each point, and projects it forward X number of bars, X being the forecast period. This projected value is then used as the LRF value for that bar.
The bands that are drawn use a standard deviation that changes over time. The standard deviations are computed just as they are for the Linear Regression study. The standard deviation multiplier specified in the preferences is multiplied by the standard deviation value to determine how far the bands will be drawn from the base line.
The Linear Regression Oscillator represents the number of standard deviations of current price from the linear regression line. A value of 2 means that price is currently 2 standard deviations above the linear regression line (using the regression period specified...ending on that bar). A value of -1.5 means price is currently 1 1/2 standard deviations below the regression line. This options has been added as a "Linear Regression Oscillator" check box to the LRF indicator. When drawn, reference lines are automatically drawn at -2, -1, 0, 1, and 2 standard deviations. It is recommended that the Linear Regression Oscillator be drawn in a separate window pane from price data. The Linear Regression Oscillator tells how far the current price has deviated from the regression trendline, in units of standard deviations, or how far the price has deviated from the general trend established by the regression analysis (using period specified).
See Also:
Presentation

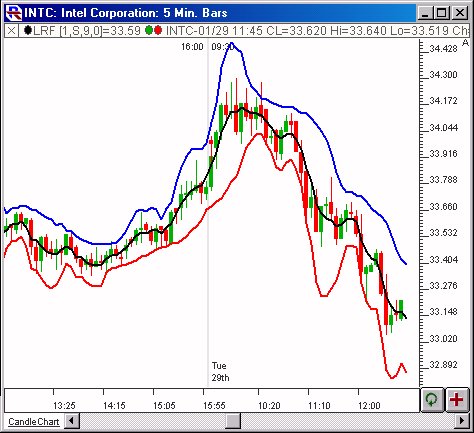
Above is a Daily Candlestick Chart of an Intel Corporation (INTC). The Linear Regression Forecast (LRF) is drawn in black, with an upper 2 standard deviation band drawn in blue, and a lower band drawn in red.
Formula
Keyboard Adjustment
The periods involved in the LRF indicator can be adjusted directly from the keyboard without opening up the preference window. First, select the indicator, then use the up and down arrow keys to adjust the regression period up or down by 1. To adjust the MA period, hold down the shift-key while hitting the up and down arrows. To adjust the forecast period, hold down the ctrl-key while hitting the up and down arrow keys.


