The McClellan Oscillator and Summation Indexes were developed by Sherman and Marian McClellan in 1969. They were developed to gain an advantage in selecting entry and exit times in the stock market.
The McClellan Oscillator offers many types of structures for interpretation, but there are two main ones. First, when the Oscillator is positive, it generally portrays money coming into the market; conversely, when it is negative, it reflects money leaving the market. Second, when the Oscillator reaches extreme readings, it can reflect an overbought or oversold condition.
Presentation

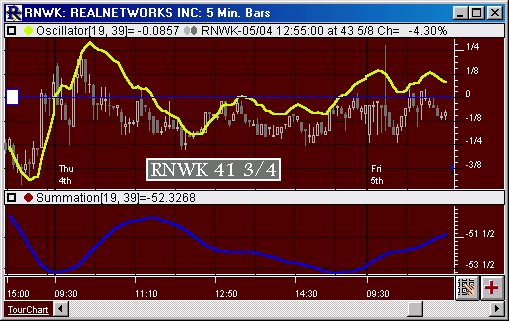
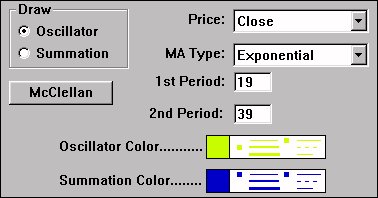
Above is a 5 Minute Candlestick Chart of Real Networks (RNWK). The yellow line in the upper pane represents the oscillator, based on the preferences below. The line overlays the candlestick chart. In the lower pane is a blue line representing a summation with the preferences below.


