TimeAndSales (RTX)

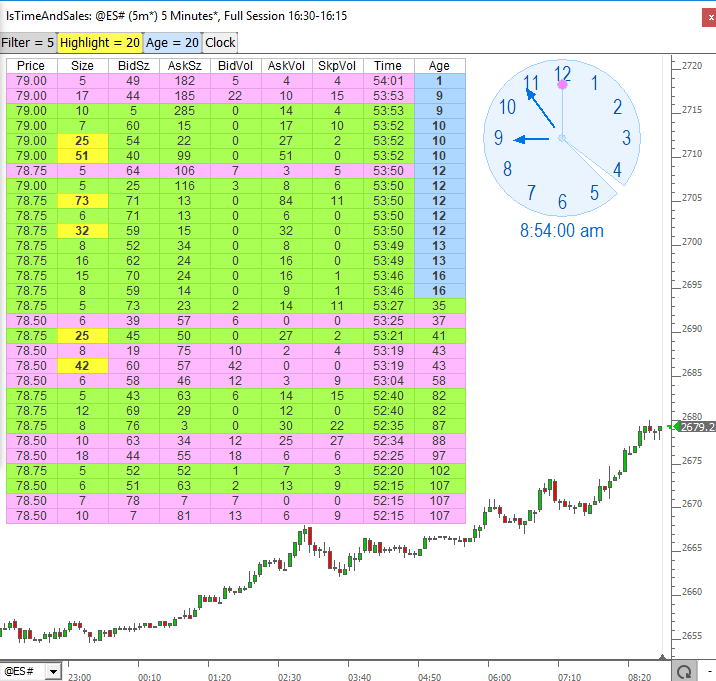
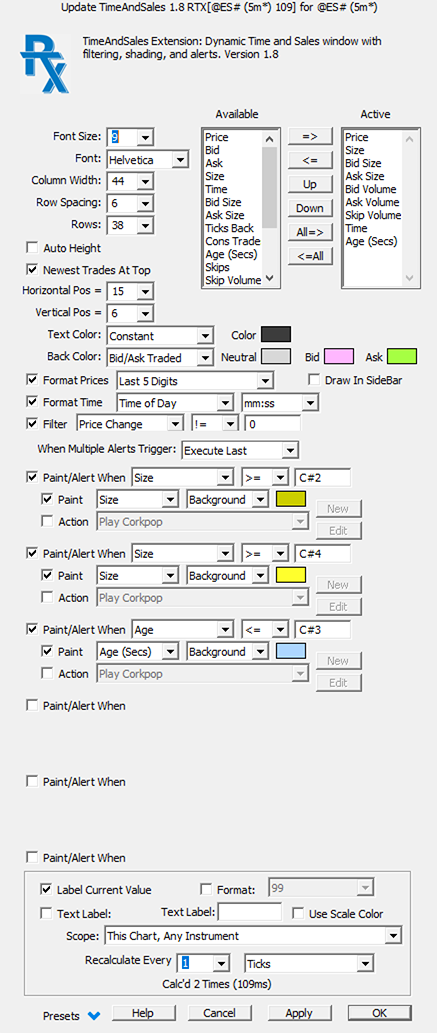
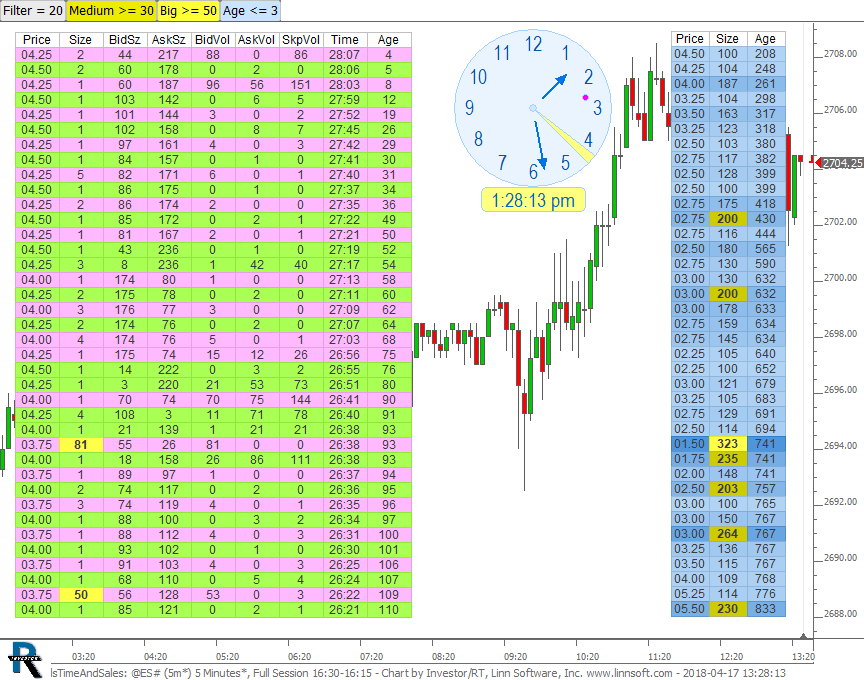
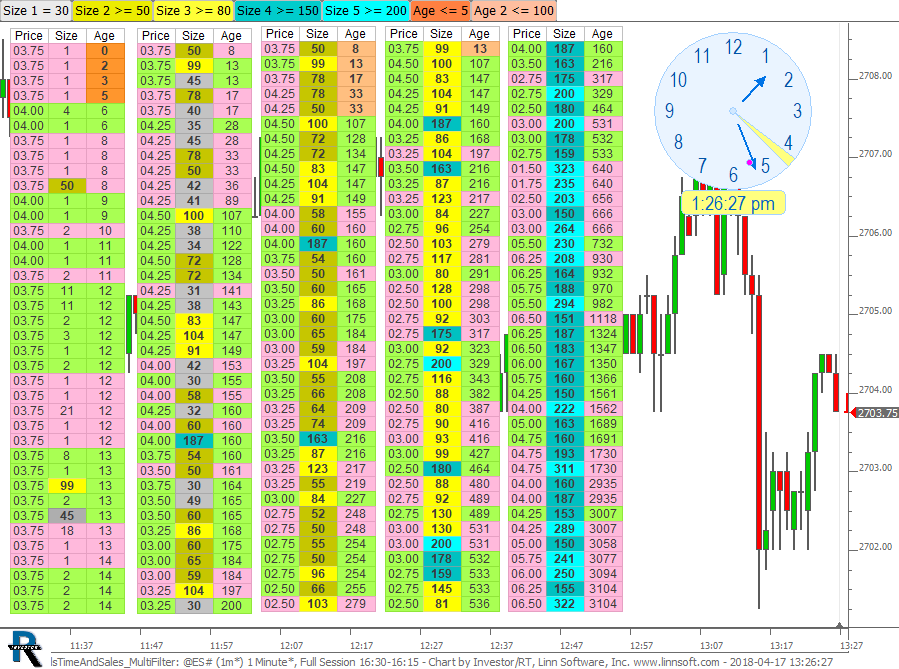
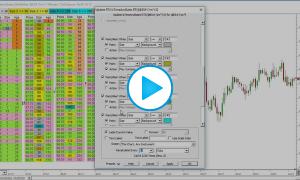
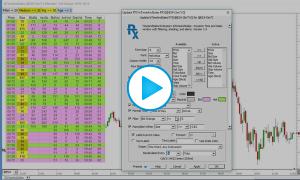
The RTX TimeAndSales extension (TAS)  is used to embed time and sales displays into any Investor/RT chart window. TAS introduces a variety of new time and sales capabilities such as flexible filtering, highlighting and alerting options and much more.  Display columns are user customizable. These include new data items of interest to traders: Skips, Bid Volume, Ask Volume, Age, Ticks Back and Consolidated Trades. A typical usage scenario would be to show only those trades with size > 30 and/or to highlight any trades >= 100 visually and/or with an audible alert.  Another example might to use the accumulate data feature (a one row display) while the auction (bid/ask price) remains the same. The row will then  show accumulated bid and ask volume, total volume, and delta for that auction and enables alerting and highlighting on any of those data values.  The power of TAS is the ability to extract and/or accumulate key data items from the tape and present it in a concise, well decorated form.  Up to 8 painting and alerting options are available with great flexibility in respect to the data used as a basis.  TAS may be positioned anywhere in a chart. A variety of options are available for row/column width and space, font size and style, and text/background coloring/painting.  TAS may be dragged and dropped anywhere in the chart using the mouse or fine-tuned using the up/down/left/right arrows on the keyboard. The TAS display is populated using historical tick data when opening the chart or changing symbols; thereafter the presentation updates as bid/ask changes and new trades occur in realtime.  TimeAndSales can be used during Playback to experiment with various settings and to observe display behavior during prior trading sessions. Buttons can be used to dynamically adjust the filtering or painting/alerting options (using C# chart variables) with immediate feedback upon changes.


Presentation

Time and Sales Prefs

  • Available / Active Columns - The Available Columns listbox provides a list of all columns available to TimeAndSales (TAS).  The Active Columns listbox dictates the order of columns that are active.  Use the => button to add an Active column or the <= to remove an Active column.  Use the Up and Down buttons to reorder the Active columns.  The topmost column in the list will appear on the left in the TimeAndSales display.
  • Font Size - Size of font used for both the column titles/headings and the data in each column/row.
  • Column Width - Width of each column in pixels.
  • Row Spacing - The space, in pixels, between the text of each row.
  • Rows - Number of Rows (or trades/quotes) that will appear in TimeAndSales window.
  • Newest Trades at Top - If checked, the new trades will enter at top of display with the oldest trades at the bottom.
  • Horizontal and Vertical Position - Controls the position of the TAS display within the chart, offset from the upper left edge of the chart (in pixels).  The TAS dispay may be dragged and dropped to any position.  Users may also select TAS and use the up/down/left/right arrow keys on keyboard to fine tune the position.
  • Text Color - Controls the color that text is painted for each trade.  Options include Constant, Bid/Ask Traded, and Volume Gradient.  Constant will color all rows in the color provided.  Bid/Ask Traded will color in the Bid color when the last trade hit the Bid, in the Ask color when last trade hit the Ask, and Neutral color otherwise.  The Volume Gradient will draw a gradient of colors between the LO and HI color based on the size of the trade.  Smaller trades will be shaded to the LO color while large trades will be shaded towards the HI color with trades above the specified max getting the HI color.
  • Background Color - Controls the color that the backround of each row is painted.  See description of Text Color options above.  In addition, a "None" option results in no background being drawn behind the text of each row.
  • Format Prices - Optional condensed formats for the Price, Bid, and Ask columns with choices including: Change From Open ($), Change from Open (Ticks), Last 2 Digits, Last 3 Digits, Last 4 Digits, Last 5 Digits, and Last 6 Digits.  These allow the columns to occupy less horizontal space which in turn can dramatically reduce the horizontal space used by the overall TAS display.
  • Format Time - Formatting options for the Time column include choices for either Time of Day or Time Into Session, as well as display options of hh:mm:ss, mm:ss, hh:mm, mm;ss, Minutes, and Seconds.
  • Filter - The filter options limits the trades that are display to those that pass the filter criteria.  For instance, only show trades with Size >- 50.  Data items include Size, Sell Size, Buy Size, Bid Change, and Price Change.  Sell Size is equivalent to the Size when the trade is a Sell (Bid Trade) and zero otherwise.  Buy Size is equal to the Size when trade is a Buy (Ask Trade) and zero otherwise.  Bid Change will be 1 when the Bid moves up (along with Ask) and will be -1 when Bid moves down, and 0 otherwise.  Specifying Bid Change != 0 would result in a new entry each time the auction (bid/ask) moved up or down.  Price Change will be 1 when price moves up, -1 when price moves down, and 0 otherwise.  Similarly, Price Change != 0 would result in a new entry each time the price moved in either direction.  Each data item can be compared relative to a number using any of these comparative symbols: >=, <=, >, <, =, ><, and !=.
  • Paint/Alert - Up to 8 Painting/Alerting options are available.  For example, the Size column can be highlighted and an audible alert played when a trade with Size >= 100 comes through.  Data items include Size, Sell Size, Buy Size, Age, Change, Bid Chg, Ask Volume, and Bid Volume and each is compared to a number using comparative options of >=, <=, >, <, =, ><, and !=.  Painting allows options to paint any or all of the columns, as well as options to paint the text, background, or border of each cell.  The Alert/Action option uses Signal Actions to trigger a flexible array of alerts, but typically limited to audible alarms.
lsTimeAndSales (@ES#)
TimeAndSales (RTX) Indicator. This chart was uploaded by Investor/RT 13.2.8 showing symbol: @ES#.

Read more Download

lsTimeAndSales MultiFilter (@ES#)
TimeAndSales - Multiple Filters. This chart was uploaded by Investor/RT 13.2.8 showing symbol: @ES#. This chart is explained in the video TimeAndSales MultiFilter

Read more Download

Pop-up Video Description View
TimeAndSales - Multiple Filters

This video demonstrates a powerful usage scenario of the TimeAndSales RTX indicator with...

 Watch
TimeAndSales
TimeAndSales (RTX)
...
 Watch