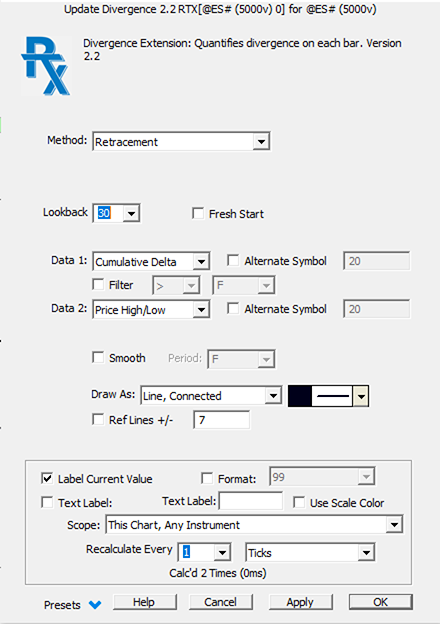
- More information on Method/Lookback/Fractal Bars see below
- Fresh Start Fresh Start prevents the divergence indicator from comparing any bar to bars in the prior session when computing results.
- Require Diverging Slopes This option is available for methods High to High and Low to Low and requires the slope of the respective data series to be on opposing sides of zero (one positive, one negative).
- Data 1 / Data 2 Each data series has the folowoing options: Price High/Low, Custom Indicator, and Cumulative Delta. Price High/Low provides the price data of the charted symbol (high/low/close). The Custom Indicator option provides the user access to any indicator in Investor/RT. The Cumulative Delta provides the bar data (high/low/close) of the Volume Breakdown Indicator setup as Delta Bars with Accumulate All Data. The Cumulative Delta option has a Filter > option which filters the cumulate delta bars to only trades above the specified size.
- Alternate Symbol Each data series has a choice for an Alternate Symbol. When this option is checked, the data series will build off the charted symbol. When checked, the user supplied symbol will be used to compute the data series.
- Smooth A smoothing option allows the user to apply a simple moving average to the results if desired.
- Draw As Divergence will typical be drawn as a Histogram or possible a dotted line, but the full array of drawing options are provided for displaying the results.
- Ref Lines +/- Reference Lines will be drawn at the specified level both above and below zero. Specify 25 to draw reference lines at +25 and -25. This value should be set to levels of significance depending on the method and data series specified above.
- Label With Bars Back When this options is checked, each Divergence value will be labelled with the number of bars back of the bar which was used in comparison with current bar in the computation of the divergence result for that bar.
- Method The explanation below of calculation methods should be reviewed in combination with the video on the Divergence indicator to get a more visual explanation of the computation methods.
Divergence Calculation Method
Introduction about the generic divergence calculation framework
The Divergence RTX main output is always based on the difference of 2 data series:
DIVERGENCE = D1RS - D2RS

	D1RS = Relative Strength of Data Series 1

	D2RS = Relative Strength of Data Series 2
Depending on the selected calculation method, each D1RS and D2RS component will be computed differently, resulting in a different Divergence RTX output value. The difference in divergence calculations (detailed below) are involving the following variables:
MAXHI1 = Highest High of Data Series 1 over Max Period

	MAXLO1 = Lowest Low of Data Series 1 over Max Period

	RANGE1 = Range of Price of Data Series 1 over Max Period (MAXHI1 - MINLO1)

	CL1 = Closing Price of each bar of Data Series 1

	MAXHI2 = Highest High of Data Series 2 over Max Period

	MAXLO2 = Lowest Low of Data Series 2 over Max Period

	RANGE2 = Range of Price of Data Series 2 over Max Period (MAXHI1 - MINLO1)

	CL2 = Closing Price of each bar of Data Series 2
For all methods, a range is used to normalize each data series into a percent change value that is comparable among data series (as both data series rarely share a common scale). For example, while Cumulative Delta may move 100,000, price may only move 2.25. To convert these change values into comparable data, we must divide the raw data by a recent range to provide a normalized percent change move.
Retracement (& Retracement since Signal) Methods
The retracement method uses a fixed lookback period, while the Retracement since Signal considers the number of bars since the last true signal
D1RS = 100 * (CL1 - MINLO1) / RANGE1

	D2RS = 100 * (CL2 - MINLO2) / RANGE1
Percent Change Method
The Percent Change method is designed to compare the extreme (high/low) prices of each bar, with the extreme prices of a range of bars in the past (determined by Min and Max Lookback), and find and return the divergence with the highest magnitude.
These 4 values are computed for each value of x from x=MinPeriod to x=MaxPeriod:
D1RS_UP = 100 * (HI1 - LO1.x) / RANGE1

	D2RS_UP = 100 * (HI2 - LO2.x) / RANGE2

	DIVERGENCE_UP - D1RS_UP - D2RS_UP

	D1RS_DN = 100 * (LO1 - HI1.x) / RANGE1

	D2RS_DN = 100 * (LO2 - HI2.x) / RANGE2

	DIVERGENCE_DN - D1RS_DN - D2RS_DN
And the divergence result with the highest magnitude is presented as the result for the bar.
High to High (Fractal) Method
The High to High method computes divergence values only on bars which form relative highs. These relative highs are determined using the Fractal method. The user supplies the fractal bars. A 5 bar up fractal has a high above or equal to the high of the 2 bars before and after it (5 bars total). A 7 bar up fractal has a high above or equal to the highs of the 3 bars before and after it (7 bars total). The high of up fractal bars is compared with the high of any up fractal bar in our prior bar window (determined by Max Lookback and Min Lookback), computes a divergence for each, and returns the divergence with the largest magnitude.
So for each fractal bar, where a prior fractal bars is x bars back (where x must be between Min Lookback and Max Lookback)...
D1RS = 100 * (HI1 - HI1.x) / RANGE1

	D2RS = 100 * (HI2 - HI2.x) / RANGE2

	DIVERGENCE.x = D1RS - D2RS
and the DIVERGENCE with the highest magnitude is what results as the divergence value for that up fractal bar.
Low to Low (Fractal) Method
The Low to Low method computes divergence values only on bars which form relative lows. These relative lows are determined using the Fractal method. The user supplies the fractal bars. A 5 bar down fractal has a low below or equal to the lows of the 2 bars before and after it (5 bars total). A 7 down bar down fractal has a low below or equal to the lows of the 3 bars before and after it (7 bars total). The low of down fractal bars is compared with the low of any down fractal bar in our prior bar window (determined by Max Lookback and Min Lookback), computes a divergence for each, and returns the divergence with the largest magnitude.
So for each fractal bar, where a prior fractal bars is x bars back (where x must be between Min Lookback and Max Lookback)...
D1RS = 100 * (LO1 - LO1.x) / RANGE1

	D2RS = 100 * (LO2 - LO2.x) / RANGE2

	DIVERGENCE.x = D1RS - D2RS
and the DIVERGENCE with the highest magnitude is what results as the divergence value for that down fractal bar.
"Aggressive" versions of the High to High & Low to Low Methods
Both High to High and Lows to Lows Methods are also available in an “aggressive” format.
Let’s first consider a High-to-High standard method with a fractal setting of 3 bars. In that case, a divergence signal can never be displayed/confirmed for the ongoing bar, as, by definition, a fractal high swing bar can only be confirmed when the 2 following bars have taken place and have lower highs.
For the aggressive method, we will get rid of that confirmation delay, ie a divergence indicator value can be displayed for the last completed bar, as soon as the high of that bar is higher than the high of the 2 preceeding bar. This means a divergence signal may be displayed for bars that are not fractal swing high or swing low.
To compare the two versions (standard and aggressive), add 2 divergence RTX indicators with the exact same settings, using each method, and check whether the aggressive method fits your needs. It will produce, of course, many more signals, including some very “desired” ones (ie early divergence warning), but also more frequent useless signals.
The Correlation Coefficient Method
The Pearson “Correlation Coefficient indicator" has been present in the Investor/RT Technical Indicator library for a long time, but it was restricted to measuring the linear correlation between 2 instruments.
For the record, the Pearson coefficient uses a statistical formula (covariance) to measure how closely the data points combining the two data sources (with each data series plotted on an x/y axis scale) approximate the line of best fit (that can be assessed through a regression analysis). A coefficient of +1 value describes a perfect fit, while a value of -1 would correspond to a perfect inverted correlation. The closer the correlation coefficient is to zero, the weaker the correlation.
This same Correlation Coefficient method is available in the Divergence RTX.