True Strength Squeeze (RTX)

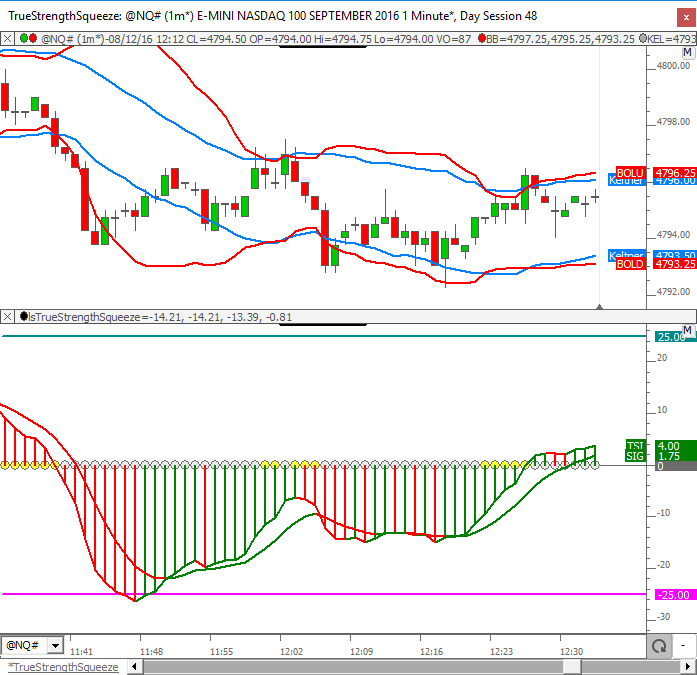
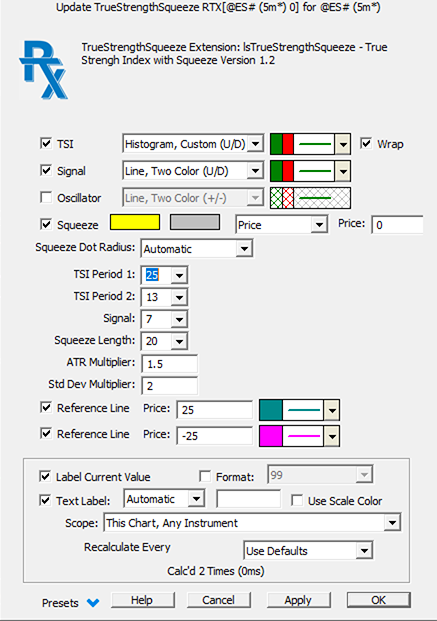
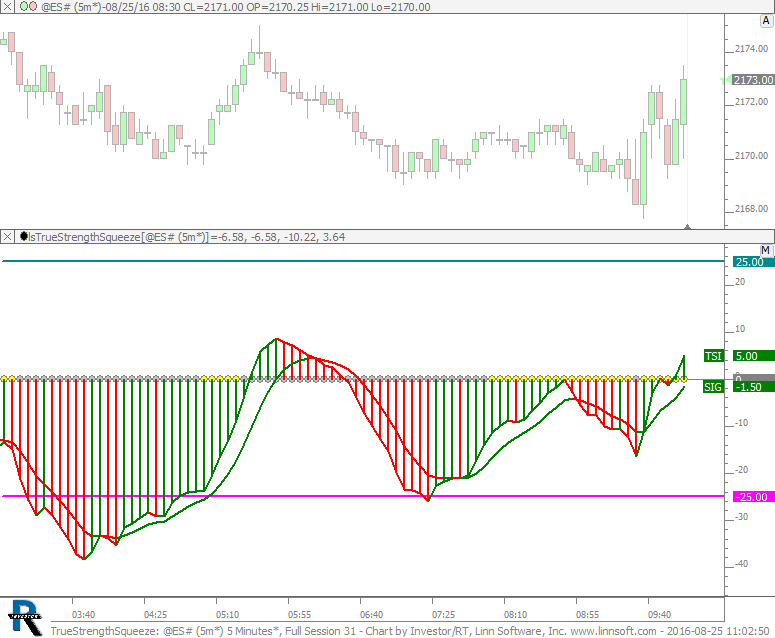
The TrueStrengthSqueeze (RTX) Indicator combines the True Strength Index with the Squeeze Indicator.  The True Strength Index attemps to show both trend direction and overbought or oversold conditions using double-smoothing of momentum relative to double-smoothing of the absolute value of momentum.  The Squeeze Indicator identies when the Bollinger Bands are within the Keltner Channel.  Both Bollinger Bands and Keltner Channels center about a moving average of the close with the Bollinger Bands using a multiple of standard deviations and the Keltner Channels using a multiple of Average True Range.  The indicator provides options and draw styles for the TSI, the Signal Line, and the Oscillator.  The Signal Line is a moving average of the TSI line and the Oscillator is simply the difference between the TSI and the Signal Line.  When Squeeze is turned on, dots are draw that reflect when a squeeze in in play.  The TSI has a "Wrap" checkbox option which will wrap the 2-color histogram with a 2-color line.  TSI values above 25 are typically considered overbought while TSI values below -25 are typically considered underbought.  A rising TSI suggests an uptrend while a falling TSI suggests a downtrend.

Presentation

Formula

True Strength Squeeze Prefs

  • TSI - True Strength Index - Check this option to draw the TSI in the style and color specified.  A "Wrap" checkbox option comes in handy when the TSI is draw as a histogram and user would like to wrap the histogram with a 2-colored line.
  • Signal - The Signal line is a moving average of the TSI line, using the Signal period specified.
  • Oscillator - The Oscillator is the difference between the TSI and the Signal line.
  • Squeeze - The Squeeze indicator draws dots in the 1st color when squeeze is on and in the 2nd color when squeeze is off.  Squeeze indicators that the Bollinger Band lies inside of the Keltner Channel.  By default, the dots will be drawn on the zero line but options are available to draw the dots at top of pane, bottom of pane, on the TSI line, the Signal line, or the Oscillator.
  • TSI Period 1 - First smoothing period used in the calculation of the TSI.
  • TSI Period 2 - Second smoothing period used in the calculation of the TSI.
  • Signal - Period used when smoothing the TSI into the Signal line.
  • Squeeze Length - Length used in the computation of the Bollinger Band and Keltner Channels upon which the Squeeze is based.
  • ATR Multiplier - Multiplier used in the calculation of the Keltner Channels.
  • Std Dev Multiplier - Multipier used in the calculation of the Bollinger Bands.
  • Reference Line - User has 2 built in options for reference lines, each with own price, color and style.
TrueStrengthSqueeze (@ES#)
TrueStrengthSqueeze (RTX). This chart was uploaded by Investor/RT 12.6.1 showing symbol: @ES#.

Read more Download

Pop-up Video Description View
True Strength Squeeze
TrueStrengthSqueeze (RTX) Introduction

This video introduces the TrueStrengthSqueeze RTX Indicator. The TrueStrengthSqueeze (RTX)...

 Watch