Pivot Point

The Pivot Point study is one which works best in markets with a wide daily trading range (high volatility). The study uses the previous day high, low, close, and open price to generate a pivot, two support levels, and two resistance levels. Because it is generated from daily data it is recommended that you check the "Use Daily" checkbox when adding this study to an intraday chart. Otherwise, the pivot point lines will be calculated using bars of whatever periodicity the chart is in.

Price crossing the pivot on an up move is a bullish event; a cross below the pivot on a down move is a bearish event. Once a bullish indication has registered the study offers two resistance levels for the price to test. If the first resistance is penetrated price can be expected to test the second resistance. The same idea holds true for the support levels on a downward cross of the pivot point.

Choosing a Pivot Point

The user now has a great deal of flexibility available in selecting what data will be used in calculating the pivot point and the support and resistance levels. Some of the pivot point options include:

  • (High + Low)/2
  • (High + Low + CL.1)/3
  • (High + Low + CL.1 + OP.1)/4
  • (High + Low + CL.1 + OP)/4
  • (High + Low + CL + OP)/4
  • (High + Low + CL)/3
  • (High + Low + OP)/3
  • (High + Low + 2*OP)/4

The expression CL.1 represents the closing price of the previous day, while the expression OP represents the opening price of the current day or session. Notice that each expression has two common components, High and Low. The values used for the High and Low will in turn be based upon what is selected from the list box in the preferences. Some choices available for High include:

  • HI.1
  • HI
  • MAX(HI, HI.1)
  • MAX(HI, HI.1, HI.1)
  • V#1
  • V#2
  • V#3
  • . . .

Whatever expression is selected here will be substituted for "High" in the equation for Pivot Point, as well as the equations for support and resistance levels Similar, whatever expression is chosen in the "Low" listbox will be substituted for "Low" in all equations.

As an example, assume the user chose the following options:

Pivot Point: (High + Low + CL.1) / 3 High: HI.1 Low: MIN(LO, LO.1)

Then the resulting equations for Pivot Point and 1st Support and Resistance would be:

Pivot Point: (HI.1 + MIN(LO, LO.1) + CL.1) / 3
1st Support: 2*PP - HI.1
1st Resistance: 2*PP - MIN(LO, LO.1)

Another option subsequently added to the Pivot Point study allows for the viewing of historical daily pivot levels on intraday charts. When the "Use Daily" options is selected, you can then specify how many bars back you would like to base the calculation of your pivot levels. For instance, if you chose 1 bar back, you would see yesterday's pivot levels. Conversely, if you specify -1, you would see tomorrows pivot levels. You will only be able to view tomorrows pivot levels if you pivot level calculations do not rely on the current days data (only previous days data). This historical option also works with weekly and monthly options.

The following custom indicators can be used to represent the 4th and 5th support and resistance levels.

S4: (HI.1 + LO.1 + CL.1)/3 – (2 * HI.1 – 2 * LO.1)
S5: 2 * (HI.1 + LO.1 + CL.1)/3 – (3 * HI.1 – 2 * LO.1)
R4: (HI.1 + LO.1 + CL.1)/3 + (2 * HI.1 – 2 * LO.1)
R5: 2 * (HI.1 + LO.1 + CL.1)/3 + (2 * HI.1 – 3 * LO.1)

Once these custom indicators are created, they should be added to intraday charts using the MPD (Mixed Periodicity Data) indicator (one for each custom indicator). Setup MPD with "Mix Periodicity: Daily", "Data Source: Indicator: CI: Custom Indicator" (and choose one of the custom indicators you've created), and "Stretch" should be checked.

These 4 support and resistance levels have more concise formulas if you use the MID and HLR tokens. MID.x is equivalent to (HI.x + LO.x + CL.x)/3. The HLR (High Low Range) token HLR.x is equivalent to (HI.x - LO.x). Thus we have:

S4: MID.1 - (2 * HLR.1); S5: MID.1 - (2 * HLR.1) - HI.1; R4: MID.1 + (2 * HLR.1); R5: (2 * MID.1) + (2 * HLR.1) - LO.1
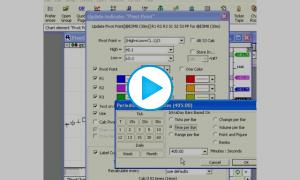
Presentation

pp

Above is a 5-Minute Chart of an Intel Corporation (INTC) . The five colored reference lines represent the pivot point, 1st and 2nd support, and 1st and 2nd resistance levels.

Formula

ppPrefs

  • Pivot Point = -The user may choose from several different options for calculating the Pivot Point, each including a high and low component. Some examples include: (High + Low)/2 , (High + Low + CL.1)/3, (High + Low + CL.1 + OP.1)/4, (High + Low + CL.1 + OP)/4, (High + Low + CL + OP)/4, (High + Low + CL)/3, (High + Low + OP)/3, (High + Low + 2*OP)/4 or (High + Low + SETTLE)/3

  • High -This selection for the High expression will be used in the calculation of the Pivot Point value as well as the Support and Resistance Values. Options include: HI.1, HI, MAX(HI, HI.1), MAX(HI, HI.1, HI.2), MAX(HI.1, HI.2), or any custom V# variable.

  • Low -This selection for the Low expression will be used in the calculation of the Pivot Point value as well as the Support and Resistance Values. Options include: LO.1, LO, MIN(LO, LO.1), MIN(LO, LO.1, LO.2), MIN(LO.1, LO.2), or any custom V# variable.

  • Alt S3 Calc -When checked, the S3 is calculated as PP - 2 * (HI - LO) instead of the traditional HI + 2 * (PP - LO). Similarly, R3 will be calculated as PP + 2 * (HI - LO) instead of the traditional LO - 2 * (HI - PP).
  • Store In V# -This option allows the user to store the pivot levels automatically into a series of V# variables. This method can be handy for transferring pivot levels to TPO Profile charts Automating Pivot Support and Resistance Levels
  • Pivot Point -Specify whether or not to draw Pivot Point line, as well as the color of the line in the chart.
  • 1st (Resistance) -Specify whether or not to draw 1st Resistance line, as well as the color of the line in the chart.
  • 2nd (Resistance) -Specify whether or not to draw 2nd Resistance line, as well as the color of the line in the chart.
  • 3rd ( Resistance) -Specify whether or not to draw 3rd Resistance line, as well as the color of the line in the chart.
  • 1st (Support) -Specify whether or not to draw 1st Support line, as well as the color of the line in the chart.
  • 2nd (Support) -Specify whether or not to draw 2nd Support line, as well as the color of the line in the chart.
  • 3rd ( Support) -Specify whether or not to draw 3rd Support line, as well as the color of the line in the chart.
  • Pivot Point -The user may choose from three different options for calculating the Pivot Point: (HI + LO)/2 , (HI + LO + CL)/3, or (OP + HI + LO + CL)/4
  • Draw current lines -Check here to draw horizontal reference lines at current support and resistance levels.
  • Draw historical graphs -Check here to draw historical lines for support and resistance.
  • Use Daily/Weekly/Monthly -This option allows you to use Daily, Weekly, Or Monthly Data when computing the pivot point levels for an intraday chart.
  • Beginning X Days Back -This gives the user the ability to study the daily pivot point levels historically on an intraday chart. Specifying 1 day back will result in the levels for yesterday. If your equations do not reference current days data, then you can also specify a -1 in this box to look at tomorrows levels. This value can be adjusted by selecting the pivot study in the chart, and using the left and right arrow keys on your keyboard to move it one day (week/month) right or left.
  • One Color -This option allows the user to specify only one color for all lines in the study. When the checkbox is checked, all color controls except one will be hidden.
  • R0.5, R1.5, R2.5, S0.5, S1.5, S2.5 -These options allow you to draw support at resistance levels at the midpoints of the major support and resistance lines.
Price Pivot Effectiveness Daily
Companion chart to Homework #20: Measuring Effectiveness of Key Prices as Reversal Prices

Read more Download

Price Pivot Effectiveness Intraday
Companion chart to Homework #20: Measuring Effectiveness of Key Prices as Reversal Prices

Read more Download

IB Range Statistics
Companion chart to Extracting Market Behavior Lesson 5: Profile on Indicator: Info Box Statistics

Read more Download

IB Range Profiling
Companion chart to Extracting Market Behavior Lesson 3: Profiles on Indicators: Initial Balance Range

Read more Download

Pop-up Video Description View
Pivot Point Indicator

This video is going to discuss the pivot point indicator in an Investor/RT and give you a few...

 Watch