The Commodity Channel Index (CCI) is a price momentum indicator developed by Donald R. Lambert in 1980. It is designed to detect beginning and ending market trends. CCI represents the position of current price relative to the average of price over a recent period. Lambert discussed CCI in detail in a 1980 article in Stocks and Commodities V.1:5(120-122). The CCI usually falls in a channel of -100 to 100. The conventional CCI trading system works as follows. When it rises above 100, buy and hold until CCI falls back below 100. When CCI falls below -100, sell short and cover the short when it rises above the -100 line. Some trading systems cover on a rise above minus 85. The following scans represent this strategy.
Buy Signal CCI > 100 AND CCI.1 <= 100
Sell Signal CCI < -100 AND CCI.1 >= -100
A more aggressive use of the CCI indicator dictates entering positions when the index crosses the 0 line. This method helps incorporate the early part of a new move. When the CCI crosses above the 0 line from negative territory, this is a bullish signal. When the CCI crosses below the 0 line from positive territory, this is a bearish signal. The following scans represent this strategy.
Buy Signal CCI > 0 AND CCI.1 <= 0
Sell Signal CCI < 0 AND CCI.1 >= 0
Some traders use this indicator in the exact opposite way. They interpret levels above 100 as overbought regions and bearish signals, and levels below -100 as oversold regions and bullish signals.
A proprietary indicator derived from the CCI, called Woodie's CCI is also available in Investor/RT.
Presentation

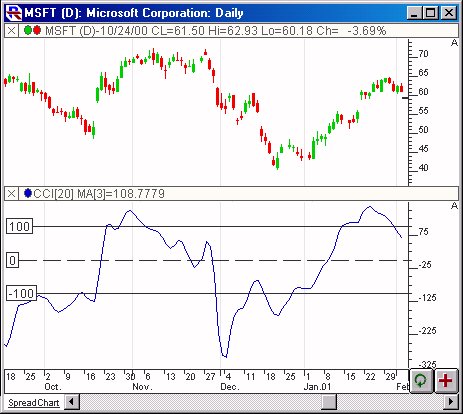
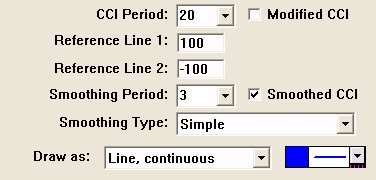
Above is a Daily Candlestick Chart of the Microsoft Corporation (MSFT). The blue line in the lower window pane represents the CCI using the preferences seen in the window below.
The Formula
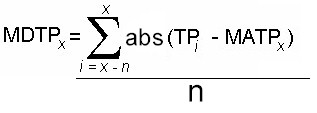
TP = (HI + LO + CL) / 3 TP stands for Typical Price MATP = MA(TP, n) n = CCI Period MATP stands for Moving Average (Simple) of Typical Price  where n = CCI Period MDTP stands for Mean Deviation of Typical Price CCI = (TP - MATP) / (MDTP * 0.015)
Modified CCI When "Modified CCI" is checked, the Typical Price is calculated differently, as seen below. Otherwise, the calculations are identical.
TP = (Max(HI,n) + Min(LO,n) + CL) / 3 n = CCI Period TP stands for Typical Price
Keyboard Adjustment
The periods involved in the CCI indicator can be adjusted directly from they keyboard without opening up the preference window. First, select the indicator, then use the up and down arrow keys to adjust the CCI Period up or down by 1. To adjust the Smoothing Period (assuming "Smoothed CCI" is turned on), hold down the shift-key while hitting the up and down arrows.


