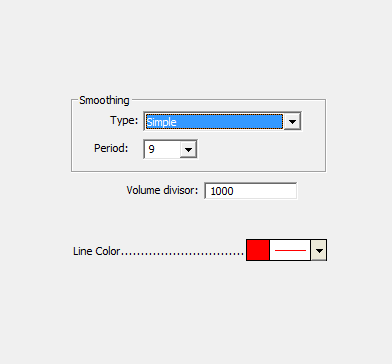
The Money Flow Indicator keeps a running total of the money flowing into and out of a security. Money flow (MF) is calculated by multiplying the number of shares traded by the change in closing price. If prices close higher, money flow increases (by an amount equal to average price * volume / volume divisor). If prices close lower, money flow decreases (by an amount equal to average price * volume / volume divisor). Average price is equal to the average of the high, low, and closing prices. A running total is kept by adding or subtracting the current result from the previous total. A volume divisor is used to keep the actual numbers at a reasonable level.
The direction of the Money Flow line is the important component to watch, not the actual dollar amount. The indicator can be used to confirm underlying strength or weakness of a price trend. When Money Flow rises in the face of a declining price trend could indicate smart money is moving in and a bottom may be at hand, and visa versa.
Presentation
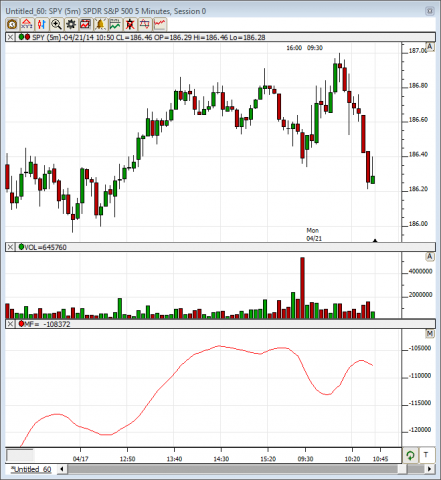
Above is a 5 Minute chart showng the SPY ETF with the Money Flow Indicator in the second Pane.