A Few Words of Caution on QuotePage Statistics Indicator
This indicator is very powerful, but at the same time, can be somewhat processor-intensive. It should be used sparingly and with caution on intraday charts/data. It it primarily designed for use on daily charts/data, but will work with any periodicity. The calculation will become more involved as the number of instruments in the target quotepage increases.
This indicator allows the user to calculate a variety of statistical results for any quotepage list of symbols, on any available technical indicator. The current list of available statistical results include Average, Sum, Maximum, Minimum, Percent of Average, Percent of Total, Percent Difference from Average, Relative Strength, Instruments with Data (Bars). For instance, you can calculate the average volume for a quotepage of symbols that contains the Nasdaq 100. You can calculate the average percent change on a quotepage that contains the S&P 500. You can calculate the maximum, minimum, average, or total spread on a quotepage that contains all optionable stocks. You can calculate the average (maximum, minimum) MACD (RSI, CCI, FASTD) for a quotepage that contains the DJI 30. You can calculate how many instruments in a quotepage evaluated TRUE for a given condition (using scan as the indicator). The possible combinations are expansive. As this indicator can be added to a chart, these values can be seen historically for all of the past bars. In order for this to work accurately, you must ensure that you have complete data on each of the symbols in the quotepage. You can verify this after adding the QuotePage Statistic indicator (QStat) to your chart by pointing to each bar. The feedback you see for each bar in the pane title for QStat will show how many symbols in the quotepage had bars on file for that time slot.
Let's call our chosen indicator result "IND". A brief description of each statistical result option follows.
- Average This represents the average of IND for all the instruments in the quotepage.
- Sum This represents the total summed values of IND for all the instruments in the quotepage.
- Maximum This represents the maximum value of IND for all the instruments in the quotepage.
- Minimum This represents the minimum value of IND for all the instruments in the quotepage.
- Percent of Average This represents the percentage of the underlying instruments IND value compared to the Average. (100 * IND / Average)
- Percent of Total This represents the percentage of the underlying instruments IND value compared to the Total. (100 * IND / Total)
- Percent Difference from Average This represents the percentage difference of the underlying instruments IND value compared to the Average. (100 * (IND - Average) / Average)
- Relative Strength This represents the percentage of IND between the Minimum and Maximum values. This value will always be between 0 (at lowest end of range of values) and 100 (at highest end of range of values). (100 * (IND - Minimum) / (Maximum - Minimum))
- Instruments with Data (Bars) This represents the number of instruments for which data existed on any given bar. Ideally, you want this number to be equal to the number of instruments in your quotepage at each bar, if you have complete data on all instruments.
- Rank (Descending) This represents the rank of the underlying instrument within the target quotepage, based on the specified criteria. With "Rank (Descending)", if the QSTAT indicator resulting value is 2, then the underlying instruments value (for the indicator specified within QSTAT preferences) is the second highest in the quotepage.
- Rank (Ascending) This represents the rank of the underlying instrument within the target quotepage, based on the specified criteria. With "Rank (Descending)", if the QSTAT indicator resulting value is 2, then the underlying instruments value (for the indicator specified within QSTAT preferences) is the second lowest in the quotepage.
- Percent True (Signals Only) This statistic is used in conjunction with the Signal Marker (SIGNAL) indicator to measure for each bar the percentage of the quotepage's instruments for which the specified signal is true. For example, you could setup a Signal Marker preset that references the signal "CL > MA" where MA is the 200 period moving average. The QSTAT indicator setup to reference this signal with the Percent True statistic, will draw a line in a chart showing bar for bar, the percentage of the instruments in the specified quotepage trading above their 200 period moving average.
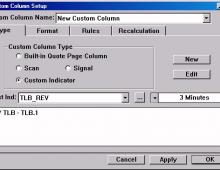
Notice that the first four options (and the last option) apply to the quotepage as a whole, while the next four options apply to the specific instrument as it relates in some aspect to the cumulative values of the group (quotepage). Quotepage Statistics can also be accessed in the RTL language using the token QSTAT. This gives the user access to QSTAT in custom indicator, scan, and custom columns. But adding QSTAT to a custom column, you can quickly see how each instrument in a quotepage performed relative to the performance of the overall quotepage using any available indicator (including custom indicators and scans) as a basis.
Presentation
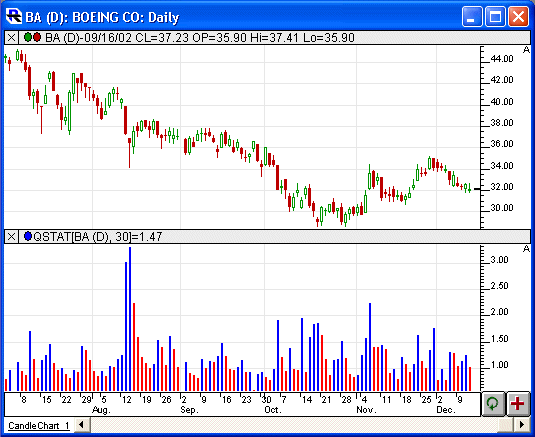
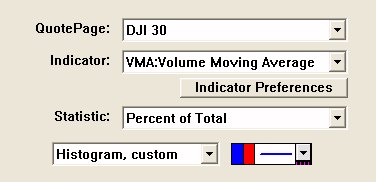
Above is a Daily Candlestick Chart of an Boeing Co (BA). The lower pane show the QuotePage Statistics indicator (QSTAT) using the preferences seen below. In this case, it's showing what percentage is the volume of BA relative to the volume of the DJI 30, for each day.


