ZigZagFlexStatistics (@ES#)
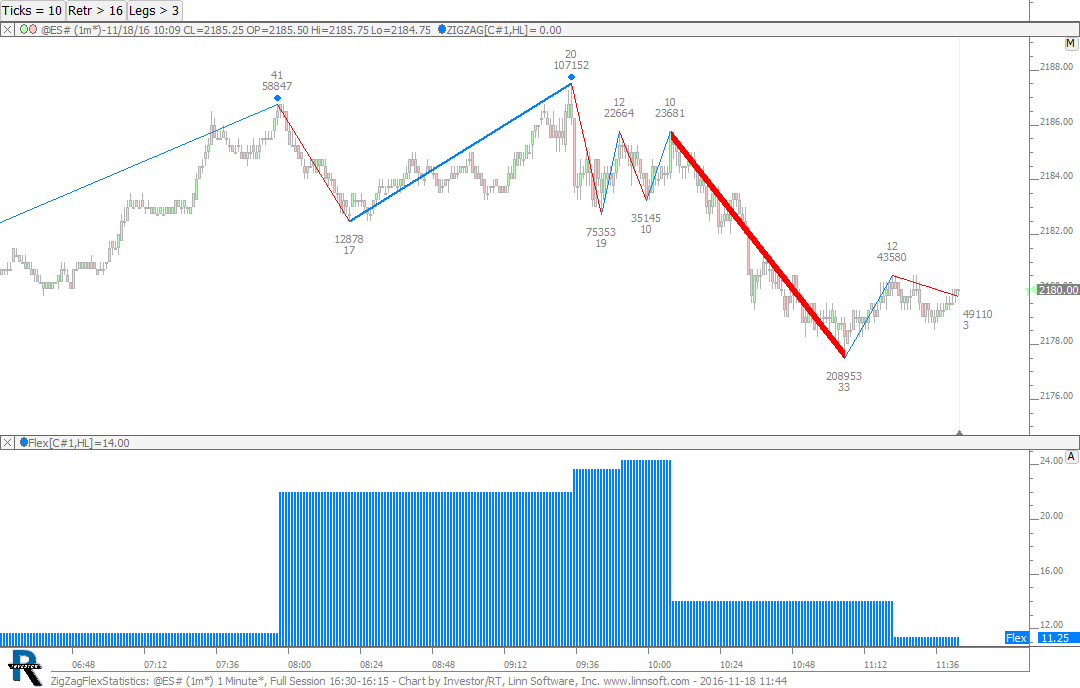
Zig Zag Oscillator Flex Statistics. This chart is explained in the video Zig Zag Oscillator: Flex Statistics. This chart was uploaded by Investor/RT 12.7.1 showing symbol: @ES#.
Zig Zag Oscillator Flex Statistics. This chart is explained in the video Zig Zag Oscillator: Flex Statistics. This chart was uploaded by Investor/RT 12.7.1 showing symbol: @ES#.
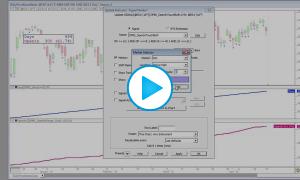
This video highlights a powerful new result option added to Zig Zag Oscillator titled Flex Statistics. This result option is flexible and powerful enough to handle most of the pre-existing result options and much much more. Flex Statistics allows the user to specify a combination of statistic (Avg, Sum, Max, Min), data item (Rotation Size, Pivot Price, Total Volume, etc), number legs, and orientation of legs (all legs, up legs only, down legs only).
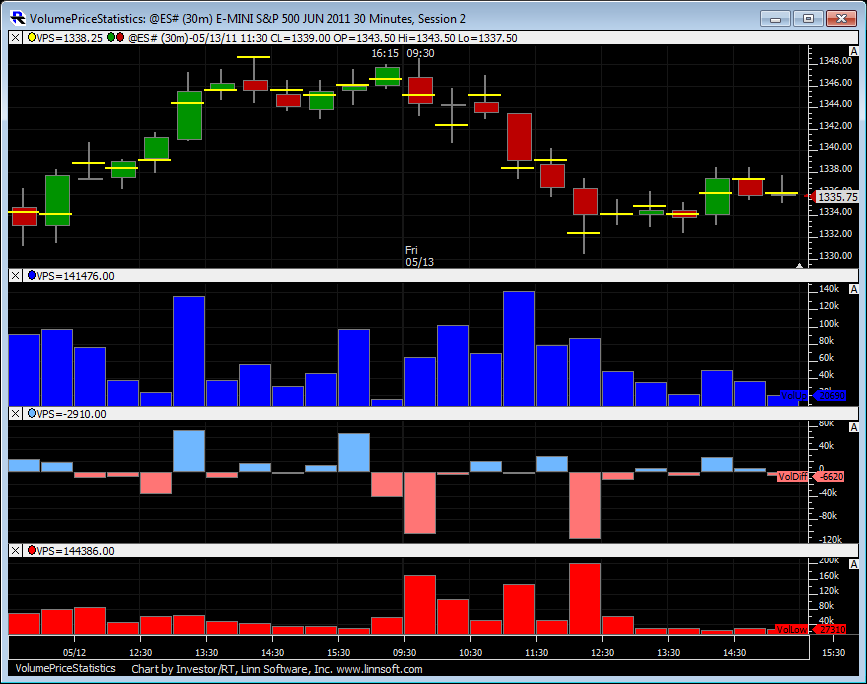
Companion chart to Homework #6: IOAMT Webinar - May-13-2011
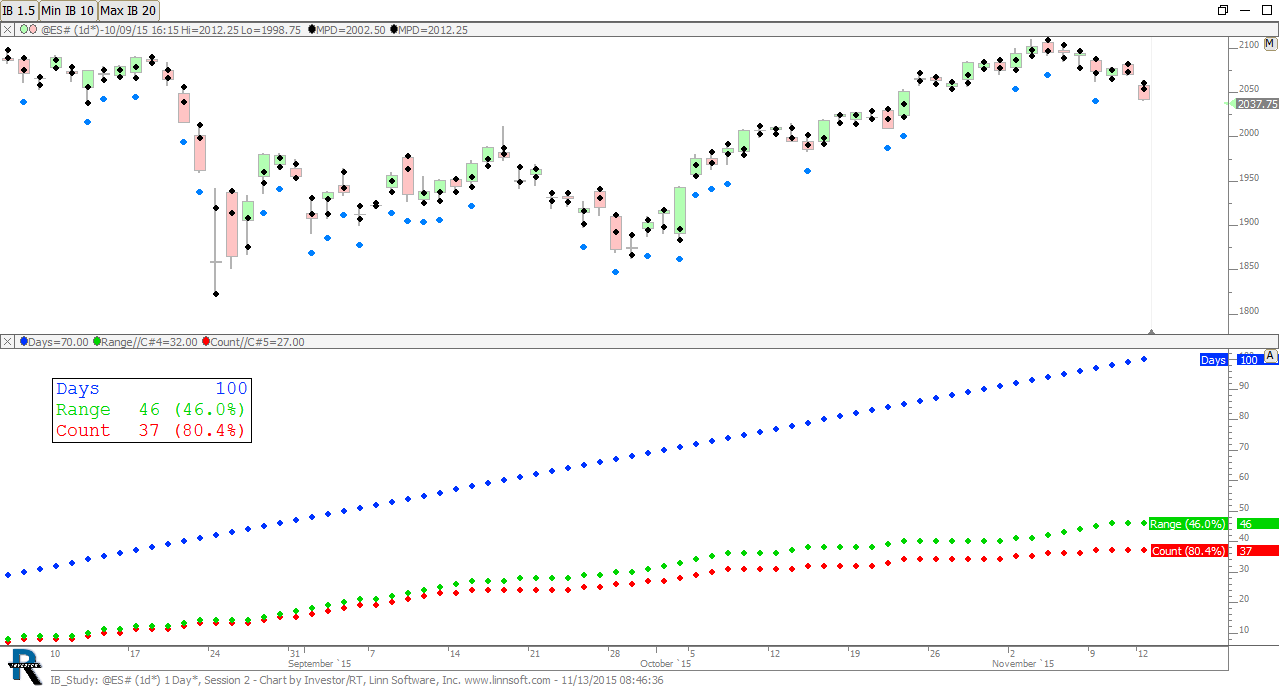
Companion chart to Extracting Market Data Lesson 2: Initial Balance Multiple Study Expanded
This video discusses how to calculate and present various daily price based statistics. For example, how often did we open inside the previous days range. And of the days we opened in range, how often did we touch or breach both the previous day high and low, and what are the percentages of these conditions happening. It also discussed how to involve value area high and low and initial balance high and low in these statistical calculations.
The Profiles on Indicators video demonstrates the exciting new Profile on Indicator functionality available in 12.2. The chart definitions for the charts used in the video as well as videos which further explain the technical details behind building each of these charts are listed below.
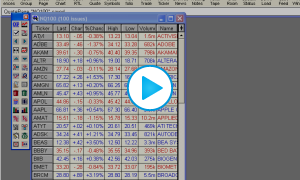
This video discusses how to import and create custom symbols which track various statistics for large lists of symbols, such as advancers/decliners, Adv/Dec volume, up ticks, up tick volume, on SP500, NQ100, or any custom list of symbols.
The videos and pages above answer question such as:
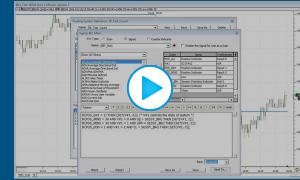
This video describes how to flexibly produce statistical results using Trading System Tools. This method can be especially beneficial when several events are required to occur sequentially within a day or session. In this specific example, we look fro price to trade above the Initial Balance High (IBH), then retest then IBH. We then count the number of times these events occurred and priced closed above the IBH or below the IBH. The definition for the Trading System featured in the video can be downloaded below.
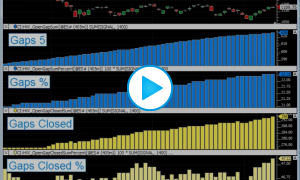
How often does price gap up or down on the ES? And when it does, how often is that gap closed.
Gap Statistics Chart Definition Gap Statistics Plus Chart Definition (This chart also shows how many days the gap was recovered by 50%. It also requires the user to set C#2 to the number of days to lookback for gap. This number will most commonly be 1. If C#2 is set to 2, it will look for a gap from 2 days ago instead of previous day)