Moving Average Ribbons (RTX)
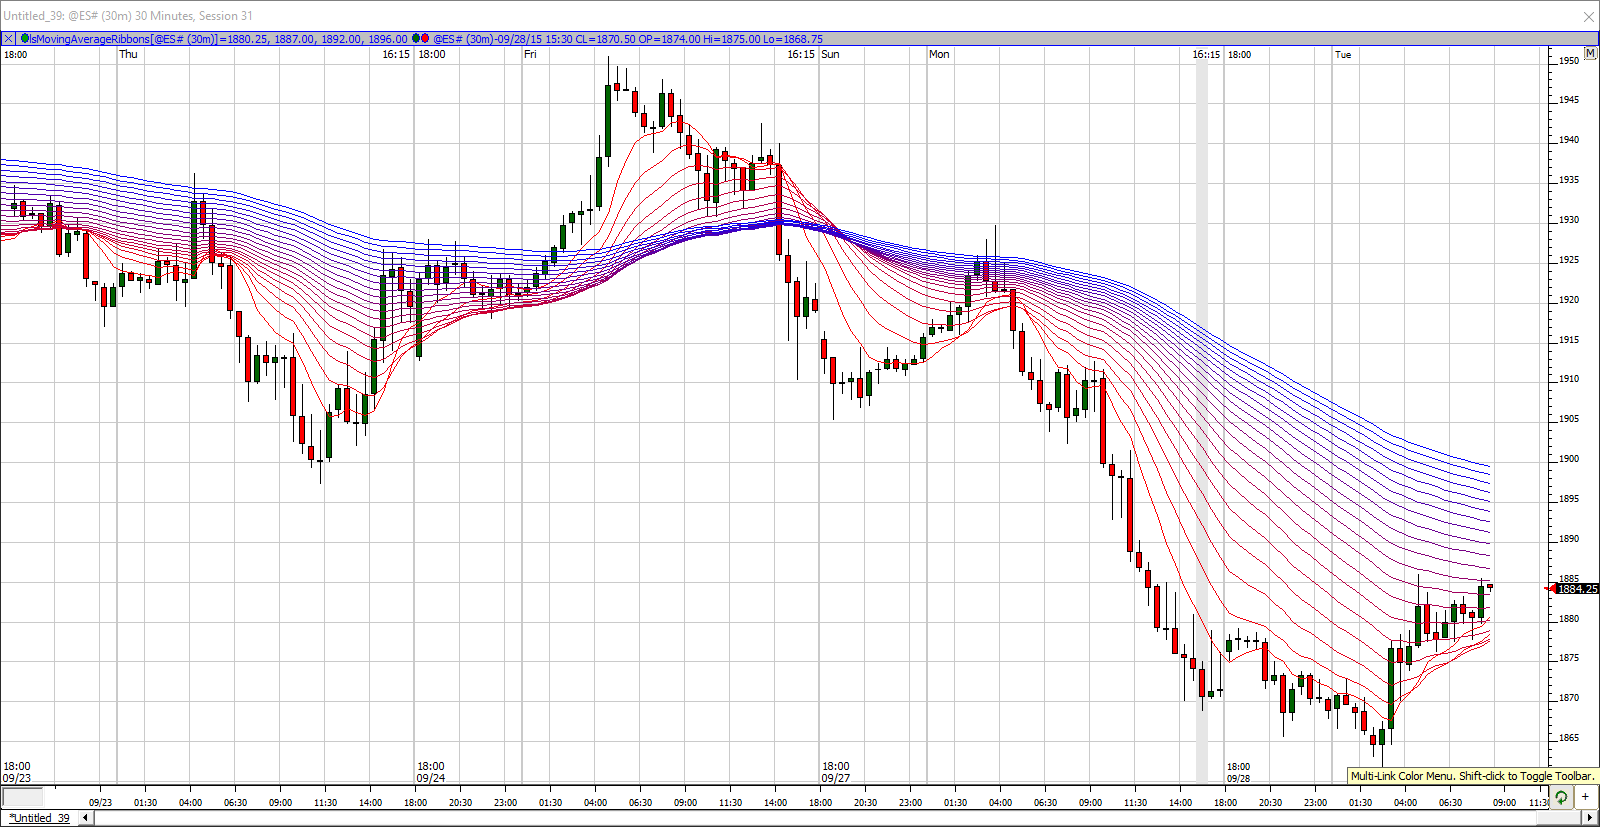
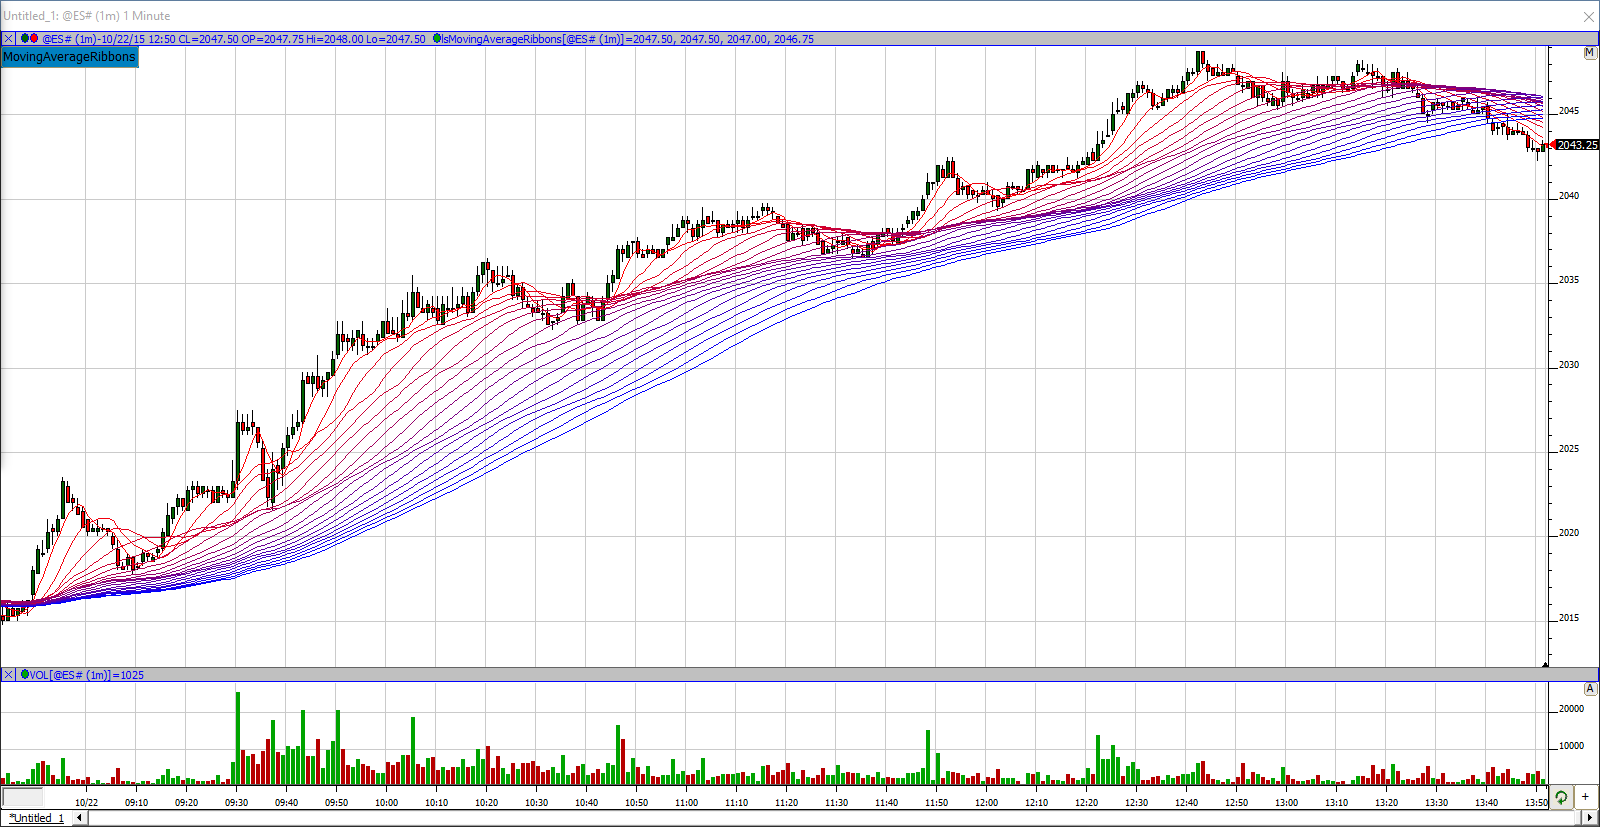
The Moving Average Ribbons Indicator allows users to set an initial Moving Average Period (Period Start) along with the desired number of Moving Average Lines (Lines) and the amount that each subsequent Moving Average should be incremented as it is added to the chart (Period Inc.). The general interpretation of this Indicator is that when all the averages are moving in the same direction, the trend is said to be strong. Reversals are confirmed when the averages crossover and head in the opposite direction. The responsiveness of the change of all of the lines is controlled by the Period Inc. setting. Incrementing each period by a smaller amount will show more responsive trend changes.
As each additional line is added from the shortest period (Period Start), the color of the lines are shaded towards the target End Color.
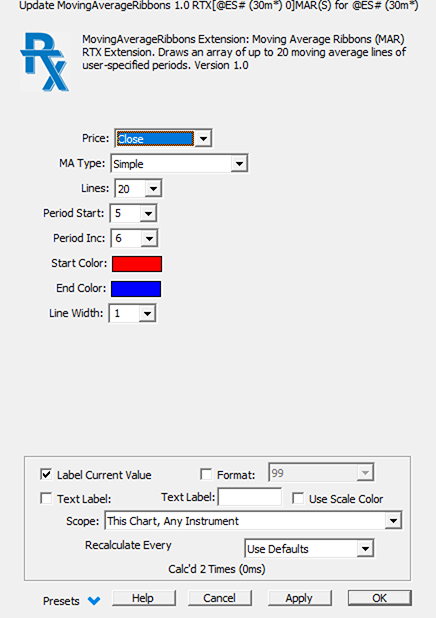
- Price - Price to use in the Moving Average Calculation
- MA Type - Type of Smoothing
- Lines - Number of Moving Average Lines to plot.
- Period Start - The starting Moving average period (smallest Period).
- Period Inc. - The increment used to add subsequent lines.
- Start Color - Color of the Period Start Line (smallest period).
- End Color - Color of the last Line added.
- Line Width - Width of each Moving Average.
|
|
RTL is the Investor/RT Language, a formula language for composing trading signals, custom indicators, and scans. RTL is an end user language, designed to be used by those with little or no programming skills. RTL is used to write a formula. A formula may be a true/false condition, e.g. CLOSE < MA, that determines whether some condition is true or not for each bar (a signal) or the last bar (a scan). A formula may compute an arithmetic result, called a custom indicator. For example: MA ( HIGH - CLOSE ) computes a moving average of how far an instrument closes from its high. As you can see, RTL is more expressive, simpler, and easier to use than other market data languagues. Read more
|