The Shape indicator is a drawing tool indicator with a button on the chart toolbar to faciliate drawing shapes at the desired location in the chart. The button depicts a red square and a blue circle. Click the toolbar button to activate the drawing tool; the cursor will change to a pencil. Drag a rectangle encompassing the region where the Shape is to be drawn. Once the Shape is in place, it can be moved by dragging the small dot which is either in the center, or lower left corner of the shape (depending on whether Center on Coordinates is checked in the Shape preferences).
It is recommended that you edit the Shape indicator preferences to set the combination of settings you would use most often. To open the preferences for the Shape, double-click on the small dot on the Shape indicator. Some may prefer a rectangle while others prefer a square. Some like blue repeating rectangles while others just want a single green ellipse. Once you have set the desired preferences, you can make this your default setting. In the preference window, choose “Presets: Make Default”. Now, each time you use the toolbar to add a Shape to your chart, the shape will inherit these default settings.
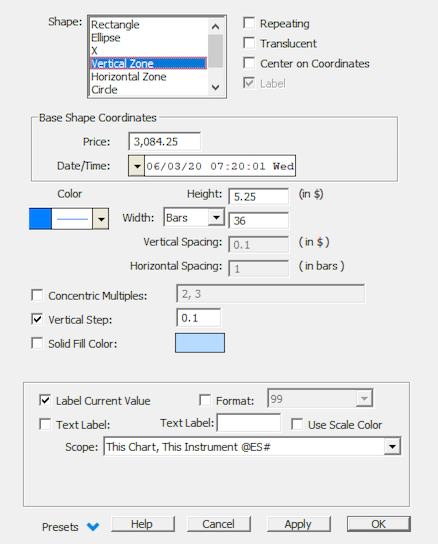
The Shape indicator is a flexible tool that allows repeating, concentric, and/or standalone shapes to be drawn in price and time throughout the chart. A base shape is positioned based on a set of price and date/time coordinates. These coordinates dictate the lower left corner or center of the base shape. The size of the shape is dictated by the height and width parameters. Height is given in units of dollars, while width uses units of bars. The base shape can be repeated continuously throughout the chart by checking the "repeating" checkbox. The repeating shapes can be spaced both vertically and horizontally. The spacing is dictated by the Vertical Spacing and Horizontal Spacing parameters in the preferences. Again, vertical space uses units of dollars while horizontal space uses units of bars. A spacing of 0 will compact the shapes side by side so that they touch.
Concentric multiples of the base shape and repeated shapes may also be drawn. To do this, check the "Concentric Multiples" checkbox, and specify the multiples which you would like drawn. The multiples may be separated with either a comma or a space. (eg. 0.5, 2, 3). A concentric multiple of 0.5 will result in a shape being drawn with half the width and height of the base shape. Similarly, a concentric multiple of 2 would result in a shape being drawn with double the width of the original shape. As their name implies, the concentric multiple shapes will share the same center point as the base shape.
If the Shape indicator is setup with the "repeating" checkbox checked, then the base shape will stand out with a slightly bolder line than the other shapes. If the "Center on Coordinates" checkbox is unchecked, the lower left corner of the base shape will be marked with a small circle, representing the price and time coordinates on which the Shape indicator is based, otherwise, the center of the base shape will be marked with a circle.
The Shape indicator was formerly called PriceTime Cycles.
Presentation
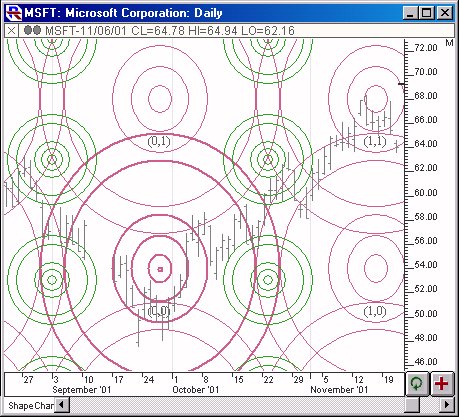
Above is a Daily Chart of Microsoft (MSFT). Two instance of the Shape indicator can be seen in the chart, in purple and green.