TradeDots (RTX)

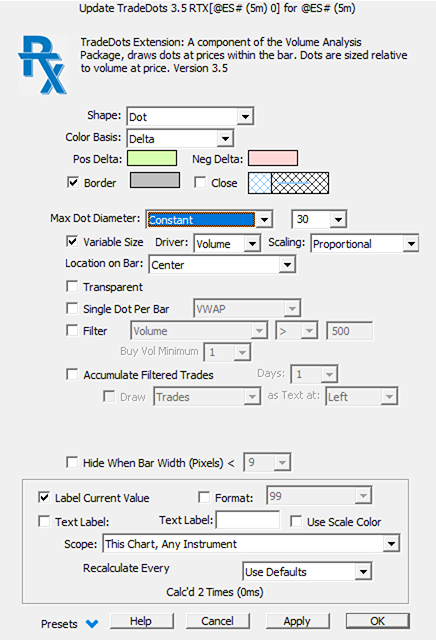
Trade Dots RTX Extension requires the Volume Analysis Package.

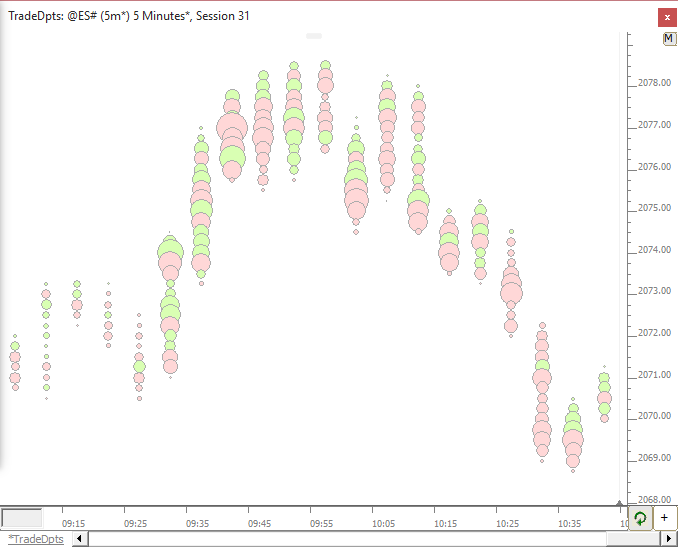
The Trade Dots extension draws dots at each price within each bar. The dots are sized in proportion to the volume traded at that price within the bar. The dots are drawn in two user-specified colors representing positive or negative delta at that price. Many options exist which control the size, scaling, shape, and coloring of each dot. A single dot mode draws one dot or shape on each bar at the VWAP or VPOC of that bar.

Presentation

TradeDots Prefs

  • Shape - Choose either a Dot, Pie, Square or Diamond as the Trade Dots Shape.
  • Color Basis - Choose what statistic you would like used to establish the basis for the color. If Delta is chosen, there are two color choices (one for Up and one for Down). If Volume or Constant are chosen, only one color control is presented.
  • Border - Add or Remove a Border and set it's color.
  • Dot Diameter - Choose either Constant Height, % of Price Height or % of Bar Width.
  • Variable Volume Diameter - Elect to have the diameter of the Trade Dot variable based on the amount of Volume at the price.
  • Scaling - This controls how each dot is scaled relative to the largest dot (largest volume price) within the visible area.  Choices are High Contrast, Proportional, Low Contrast, Lower Contrast, Lowest Contrast.  Proportional is the default and sizes each dot (area) proportial to it's volume relative to largest volume in visible area.  High Contrast gives less size to the smaller volumes (more contrast between sizes), and Low, Lower, and Lowest Contrast give increasing more size to the lower volume prices.
  • Location of Bar - Sets the location of Trade Dots relative to the Price bar in the chart.
  • Transparent - Allows for transparent colors to be used.
  • Single Dot Per Bar - When checked, the user has options to draw a single dot at either the VWAP (Volume Weighted Average Price) or VPOC (Volume Point of Control) of the bar.  The VWAP option will draw the dot size based on the volume of the bar relative to the volume of all other visible bars.  The VPOC option will draw the dot size based on the volume of the VPOC relative to volume of other visible VPOCs.
Trade Dots Chart (RTX)
Trade Dots draws Dots at each price sized relative to the volume at that price.

Read more Download

Pop-up Video Description View
Volume Filtering
Volume Filtering: Studying Behavior of Large vs Small Trades

This video introduces the ability to add a trade size volume filter to any instrument in any...

 Watch
Trade Dots Introduction (RTX)

The Trade Dots extension draws dots at each price within each bar. The dots are sized in...

 Watch