Order Flow

VolumeScope® (RTX)

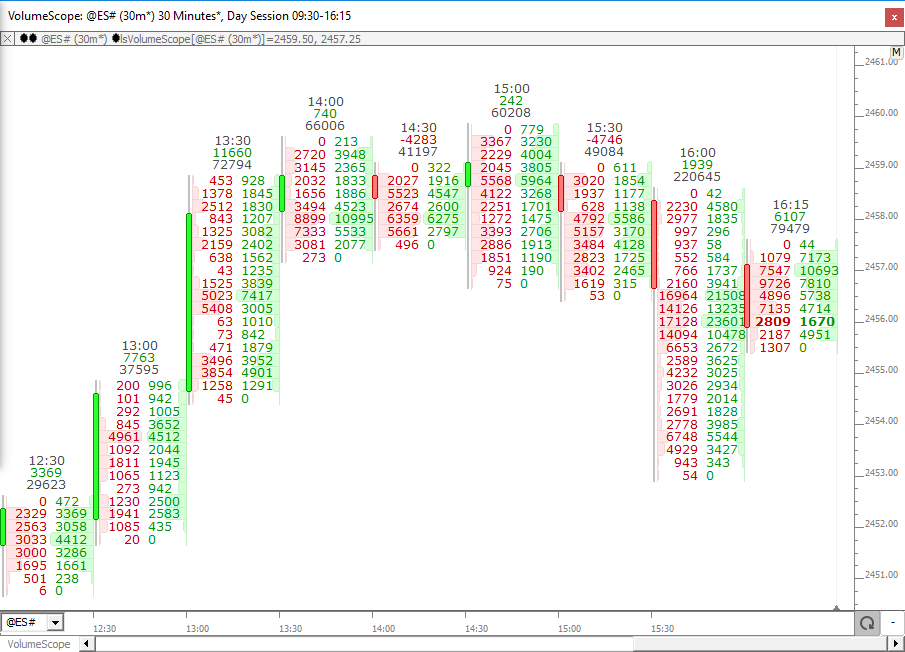
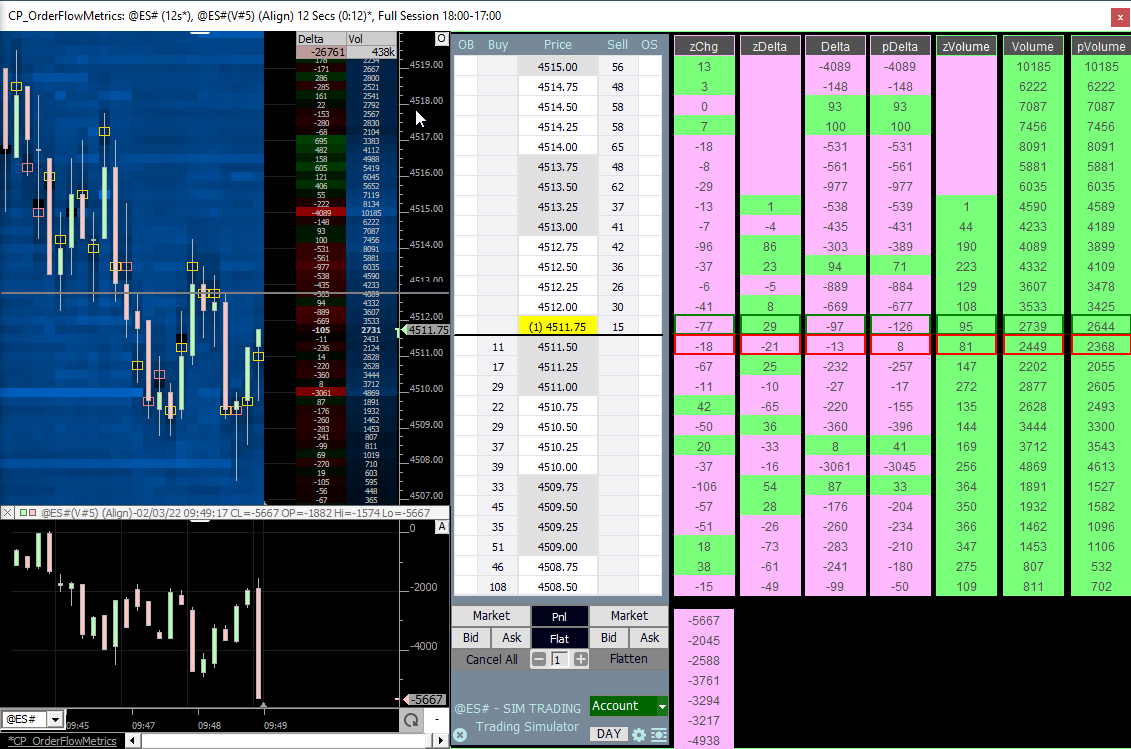
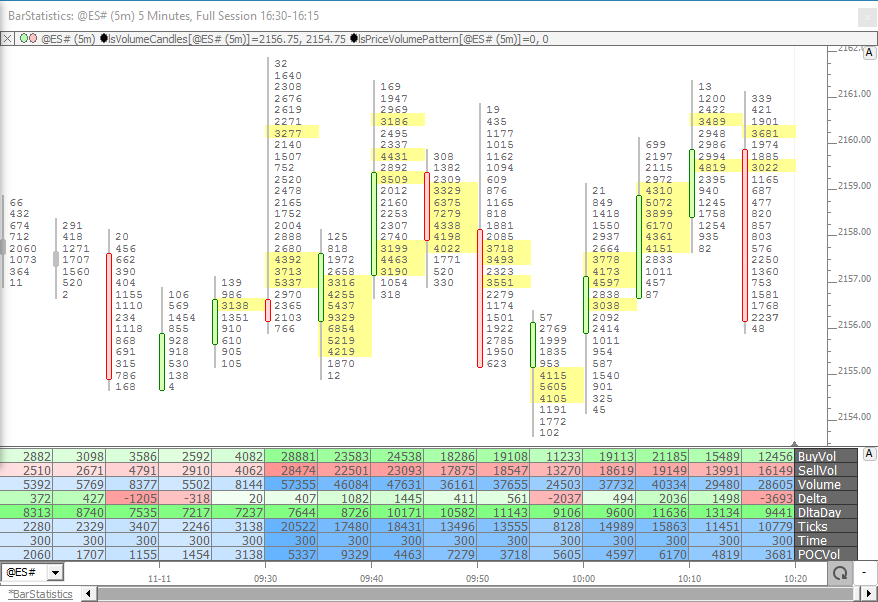
VolumeScope is the best in class footprint charting available, allowing the user to view per bar market order flow under a microscope, closely inspecting the volume at price data with great flexibility. The VolumeScope indicator has three primary components: Background, Text, and Candle. Each is optional and each has a variety of data and presention settings. Volume is broken down into Ask-Traded Volume (Buying) and Bid-Traded Volume (Selling) at each price. VolumeScope builds upon this information with profiling, coloring, and scaling options based upon relative volume, delta, imbalance, and much more.

OrderFlowMetrics (RTX)

The OrderFlowMetrics RTX Extension is a companion indicator to the DOM and provides a single column of data that can reflect change in size, size, volume, or delta over a user-specified period.

TradeBubbles (RTX)

TradeBubbles is a component of the Investor/RT Volume Analysis package. The TradeBubbles extension draws 3-dimensional bubbles at each price within the bar. The size and coloring of the bubbles are variable, driven by volume-at price data.  The most recently touched prices are drawn in front. The extension has a horizontal positioning option and a horizontal offset and drift option. These settings control drawing so that the more recently touched prices are drawn further right.  Filtering options are available at both the trade and price level (e.g. consider only big trades > 10 lots or consider only prices with large volume > 1000).  With the flexible position options the TradeBubbles can be effectively combined with other indicators such as VolumeScope or can be positioned between candles with the Centered (Right) or Centered (Left) alignment options.

ChartMiniTrader (RTX)

ChartMiniTrader is an RTX extension available to all Investor/RT subscribers. To invoke the Mini Trader, right-click in any multi-pane chart and choose Trade > ChartMiniTrader. The ChartMiniTrader is a minimalist user interface for submitting trading orders that is seen in a sidebar at the right side of the chart. Since the Mini Trader occupies only a small portion of the side typically, the side bar can also be setup to contain other RTX extension such as a Clock, or various FlexMeters. For users of CQG, Gain, and RIthmic order routing, server side OCO bracket orders are supported using Trading Strategy setups.

ExtremePriceHighlighter (RTX)

ExtremePriceHighlighter (EPH) is a powerful RTX extension that identifies and highlights extreme prices over various periods with respect to volume-at-price data.

TimeAndSales (RTX)

The RTX TimeAndSales extension (TAS)  is used to embed time and sales displays into any Investor/RT chart window. TAS introduces a variety of new time and sales capabilities such as flexible filtering, highlighting and alerting options and much more.  Display columns are user customizable. These include new data items of interest to traders: Skips, Bid Volume, Ask Volume, Age, Ticks Back and Consolidated Trades.

ChartTradingDOM (RTX)

ChartTradingDOM an RTX extension available to all Investor/RT subscribers. To invoke the DOM, right-click in any multi-pane chart and choose Trade... The ChartTradingDOM is a price ladder supporting single click in the Buy or Sell column to place limit/stop orders at specific prices. For users of RIthmic and CQG order routing, server side OCO bracket orders are supported using  Trading Strategy setups.

Price Statistics

The Price Statistics Indicator presents cumulative volume based information textual for each price over any user-specified period of time (days or bars).

Bar Statistics

The Bar Statistics Indicator presents cumulative volume based information textual for each bar.

BuySellMeter (RTX)

The BuySellMeter extension displays the buying volume versus the selling volume for a user-specified period of time expressed as a number of days or number of bars.  Buying volume is defined as volume that traded at the ask/offer price; selling volume is defined as volume traded at the bid price.  BuySellMeter provides a nice visual of these two volume metrics in a compact box that may be positioned anywhere in the chart.  The horizontal and vertical position of the box (in pixels from top left) may be entered in the indicator preferences, or you can drag and drop the box using the mouse. The position can be fine tuned by clicking inside the box to select it and then using the keyboard arrow keys.

Pages