Order Flow

BuySellMeter (RTX)

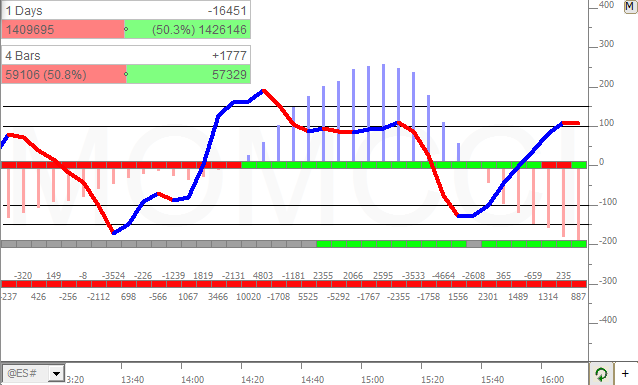
The BuySellMeter extension displays the buying volume versus the selling volume for a user-specified period of time expressed as a number of days or number of bars.  Buying volume is defined as volume that traded at the ask/offer price; selling volume is defined as volume traded at the bid price.  BuySellMeter provides a nice visual of these two volume metrics in a compact box that may be positioned anywhere in the chart.  The horizontal and vertical position of the box (in pixels from top left) may be entered in the indicator preferences, or you can drag and drop the box using the mouse. The position can be fine tuned by clicking inside the box to select it and then using the keyboard arrow keys.

Volume Candles (RTX)

Volume Candles draws a candle, volume profile, and volume as text, for each bar, making efficient use of the horizontal space available for each bar.  It is recommended to set the drawing style of the instrument to "Invisible" and then add the VolumeCandles to the instrument pane to replace the bars.  Each of the 3 elements is optional, giving users the ability to plot candles with volume profiles, volumes with volume as text, etc.  User must ensure there is enough room vertically and horizontally to properly display elements.  To create more horizontal space, use the mouse scrollbar (or up/down arrow keys on keyboard).  To create more vertical space, use the mouse scrollbar while holding down the shift key.

TradeDots (RTX)

The Trade Dots extension draws dots at each price within each bar. The dots are sized in proportion to the volume traded at that price within the bar. The dots are drawn in two user-specified colors representing positive or negative delta at that price. Many options exist which control the size, scaling, shape, and coloring of each dot. A single dot mode draws one dot or shape on each bar at the VWAP or VPOC of that bar.

Trail of Intentions (RTX)

Trail of Intentions (TINT) is an RTX Extension designed to display historical snapshots of the depth of market (order book). The market depth provides numeric insight into the intention of traders to buy and sell at various prices. TINT provides a wealth of options to visually identify relative size and changes in sizes among prices within same snapshot or from snapshot to snapshot over time.

Price Volume Pattern (RTX)

PVP is a powerful order flow pattern matching facility that works hand-in-hand with VolumeScope. It is designed to identify buy and sell volume-based patterns within a sequence of one or more prices within each bar. One-price, two-price and three-price patterns can be identified at the high of bar, low of bar, the highest or lowest occurrence within the bar, or all occurrences within each bar. Within each price within a bar, volume, ask volume, bid volume, or delta may be compared to specific values, or to multiples of volume, ask volume, bid volume, or delta. A secondary criteria is optional for each price. Prices that meet the specified criteria are identified with a drawing style such as Solid Box, Hollow Box, Dot, or Line. Customization of each style is possible by specifying a number of horizonal slices and an offset (which slice) to use. Each PVP indicator in a chart can thus be setup to draw into a different slice for each price.

Volume Breakdown (VB)

The Volume Breakdown is a powerful and flexible indicator used to gauge buying and selling pressure. It looks inside each bar, breaking down and classifying each tick and then accumulating the results (accumulation is optional), and further giving the user a variety of statistical measures (including all built-in technical indicators) to apply the these results. The most common use of the VB indicator is to calculate the delta (difference between the buy (ask-traded) and sell (bid-traded) volume) of each bar. Positive deltas signify more buying pressure, while negative deltas signify more selling pressure. The magnitude of the delta determines the strength of that pressure. Expect to see positive deltas during uptrends and negative deltas during downtrends, but look for delta turning negative at highs, or turning positive at lows...a sign of possible market turns and good entry/exit points.

Pages