The Buy/Sell Meter RTX Extension requires the Volume Analysis Package.
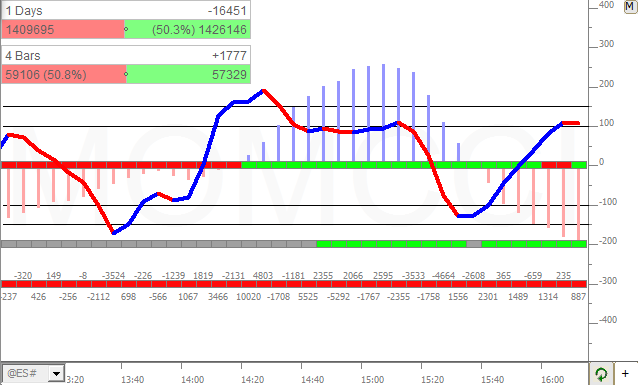
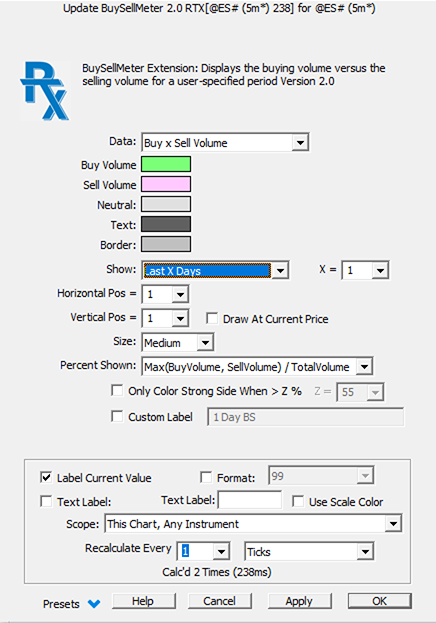
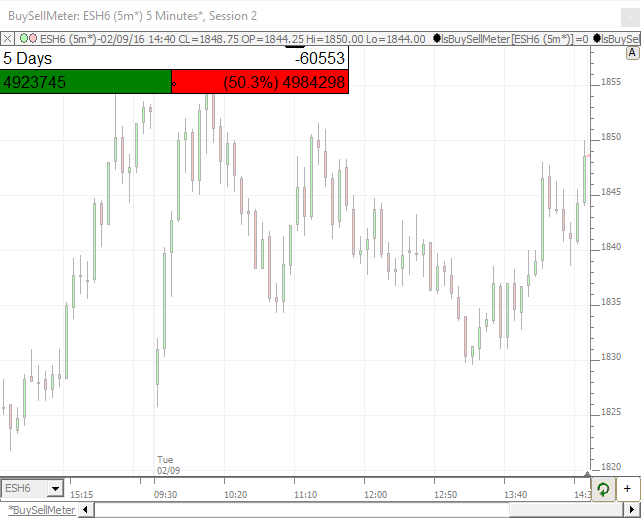
The BuySellMeter extension displays the buying volume versus the selling volume for a user-specified period of time expressed as a number of days or number of bars. Buying volume is defined as volume that traded at the ask/offer price; selling volume is defined as volume traded at the bid price. BuySellMeter provides a nice visual of these two volume metrics in a compact box that may be positioned anywhere in the chart. The horizontal and vertical position of the box (in pixels from top left) may be entered in the indicator preferences, or you can drag and drop the box using the mouse. The position can be fine tuned by clicking inside the box to select it and then using the keyboard arrow keys.
Metering Durations include: Last X Days, Last X Bars, Manual Reset, Reset When Even, Reset When Close (< X%). Last X Days and Last X Bars simply plot the buy and sell volume of the specified period. Choose "Last 1 Days" to meter the current session only. Last 2 days accumulates the prior full session and the current open session. Choose Last 1 Bar to meter buying and selling of the currently forming bar. Like all Investor/RT indicators, BuySellMeter may be added to your chart multiple times. For example, you may have one at top/left metering the open session, and another at lower right metering the bar being formed presently.
Three Reset modes are available. When Manual Reset is selected, the meter displays a clear button denoted by the letter "C". The meter is reset to 0 and begins anew accumulating buy/sell volume whenever the user clicks the C button. The other two reset options are automatic. Reset When Even will automatically reset the meter to zero whenever buy and sell volume become the equal, beginning anew from there. Thus, the metered result will always reflect the buy/sell volume since that last time buying volume and selling volume were the same. Similarly, Reset When Close (< X %), resets the meter whenever buy volume and selling volume are relatively close to each other -- whenever the magnitude of the difference between buying and selling is less that some user-specified percentage of the total volume accumulated. For example, if the meter has accumulated total volume of 1000 contracts and the X percentage is set to 3, then the meter will reset to zero automatically if buy volume and sell volume are no more than 30 contracts apart.
Presentation