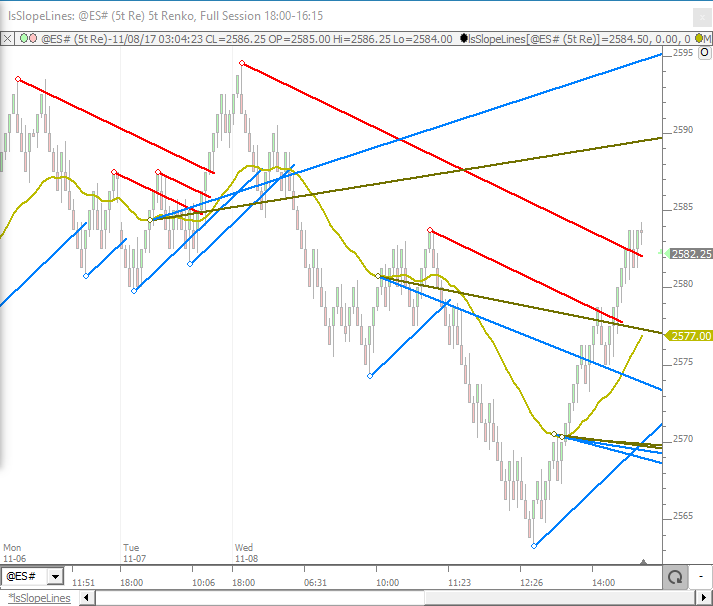
Trendlines are one of the basic trading tools used to follow trends in market data. They are easy to draw in Investor/RT using the trendline drawing tool: click on a starting point; drag and drop on the ending point. Investor/RT has some trendline automation features as well that attempt to determine the current trend and auto draw lines to depict the trend. Introducing SlopeLines - a new tool that takes trendline automation to the limit. It allows the trader to identify and fully automate the drawing of trendlines from any point(s) in the chart where a specific signal of interest has occurred!
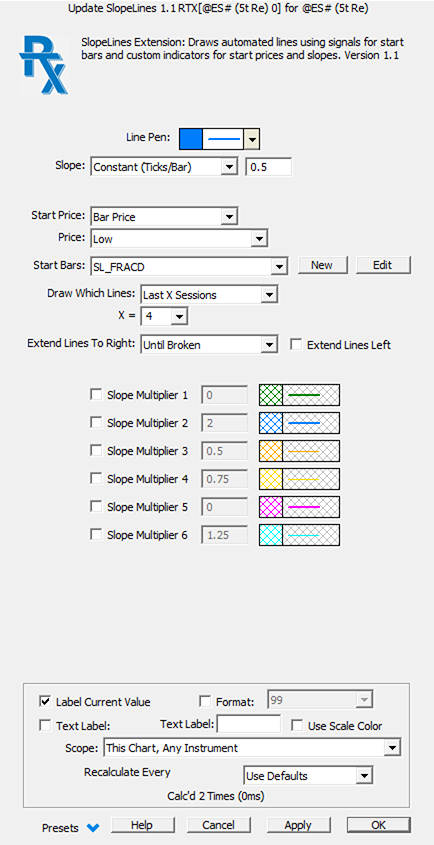
SlopeLines is an RTX Extension that automates the drawing of trendlines using the power of RTL signals and custom indicators. SlopeLines provides full control over the time (bar) in the chart where trendlines will begin, the starting price of the lines, the slope of the lines, and how far the lines extend into the future or how far back the lines will be drawn over prior trading periods. For each starting point (bar), SlopeLines can optionally draw up to six additional trendlines from the starting point, each line using a multiplier of the original slope. Each additional line can be setup with its own color and line style.
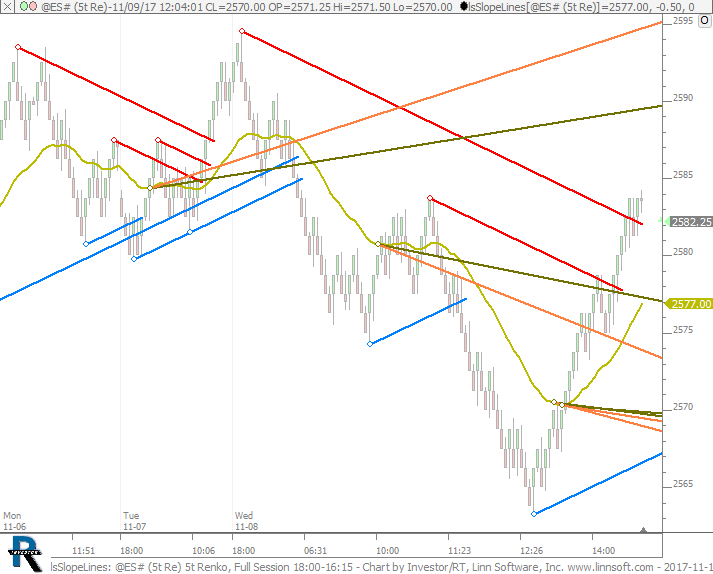
Each SlopeLines indicator in your chart specifies an RTL signal that, when true, marks the starting bar for automated trendline drawing. For example you may use a simple RTL formula to create a signal based on the Investor/RT Fractal Indicator to automate trendline drawing at locations in your chart where a significant up fractal or down fractal is found. SlopeLines has a setup that specifies the price point at these bars at which the trendline drawing should begin. This can be a known price, e.g. the mid point of the bar, the high, low, or close of the bar, or it could be a computed price, e.g. the value of a 13-period exponential moving average at the bar (value computed by an RTL custom indicator). The final component needed to draw the automated trendline(s) is the slope of the trendline. This can be a constant slope expressed in price move per bar or number of tick increments per bar (e.g. 1 tick, 0.33 tick increments per bar), or more powerfully, the slope can be determined computationally by a specified RTL custom indicator formula. Alternataively, SlopeLines can compute and use the slope of some specified custom indicator at the bar location. Continuing the Fractals example, the slope of the base trendline could be determined from the slope of some moving average line at that particular bar. The six optional trendlines are then drawn using user specified multipliers. Classic Fibonacci multipliers might be used for example to draw a fan of trendlines from each identified Fractal point.
The possibilities are endless. Think of SlopeLines as a framework for (a) identifying interesting trading points in your charts, (b) establishing a base price at each point, (c) viewing various trendline slopes that could be predictive of a change in market direction when those trendlines are hit in subsequent price action.
Presentation