TrendTool is an RTX Extension for easily drawing and editing trendlines on instruments. TrendTool does not replace the long standing Trendline indicator in Investor/RT. Think of it as a companion tool that you may prefer to use sometimes. Some may use it most of the time. TrendTool was developed using the RTX development tools. As a result, TrendTool trend lines can be edited using convenient keyboard shortcuts and mouse actions. TrendTool supports RTX Events that are triggered by chart Buttons to facilitate adjustment of many trend line settings using the keyboard or mouse, eliminating the need to call up the preferences window (see Keyboard Adjustment section below for details).
Activate the TrendTool Drawing Tool by right-clicking in the chart and using the Draw submenu. You may also create a chart button that activates the TrendTool drawing tool. Then mouse down and drag/drop a line from any start to ending point in the chart and the trendline appears. The trendline has three hotspots, one at each end point and one at the midpoint. When you hover the mouse pointer anywhere along the line the cursor changes to a pointing finger to denote you are over the line. Hover and click anywhere along the line to select the indicator, mouse down anywhere on the line to initiate a drag and drop. Drag either end point hotspot to change the location of that end point, leaving the other end anchored. Mouse down anywhere between the two endpoints to Drag and drop the line, retaining the same slope. The hot spots are solid filled to denote when the line is selected. They are hollow otherwise. The line thickness does not change when the line is selected. When a line is selected, press the Delete key to remove the line from the chart, or the enter key to call up the TrendTool preferences.
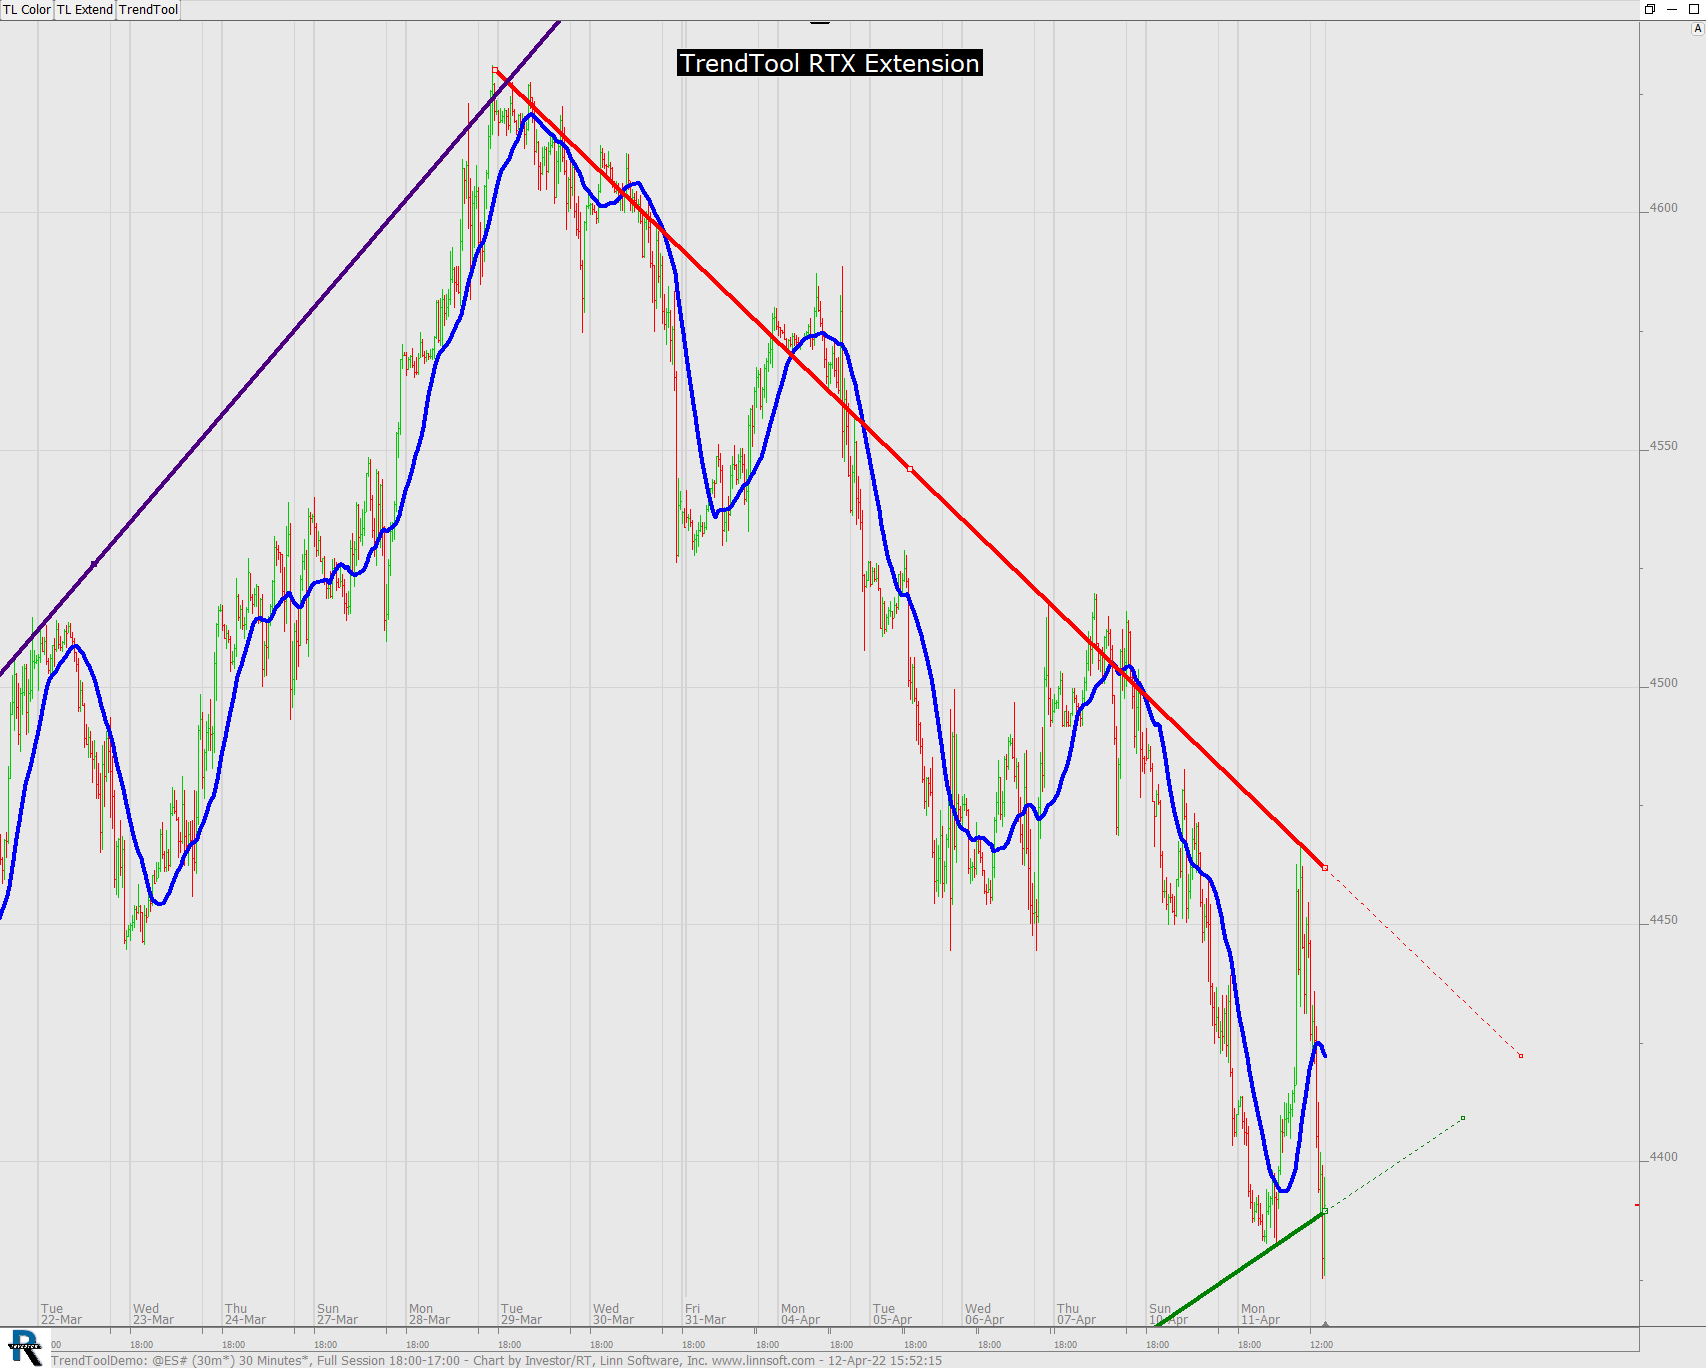
Sometimes, you may want to use a trendline to visualize the major up trend or down trend for the visible bars in the chart. TrendTool drawing tool automates this process. Here's how:
- First Invoke the TrendTool drawing tool to add a new trendline,
- Then Hold down the Control key
- Mouse down anywhere and draw a short up or downward sloping line.
- Release the mouse, trendtool determines the major up or down trend within the visible bars and automatically places the trendline. If you drag up and to the right to a higher price level, the auto trendline will be drawn from the lowest low in the visible bar to the highest hi following that low. Similarly if you draw a downward sloping line, the trendline will be drawn from the highest high in the visible bars to the lowest low following that high. You can then adjust the resulting trendline in normal way.
After drawing a major trend, it may be useful to de-select the resulting trendline (click anywhere off the line), then use the mouse wheel to zoom in or out, changing the number of visible bars. Then repeat the Control key drawing method to add another major trend line for the new new visible range of bars.
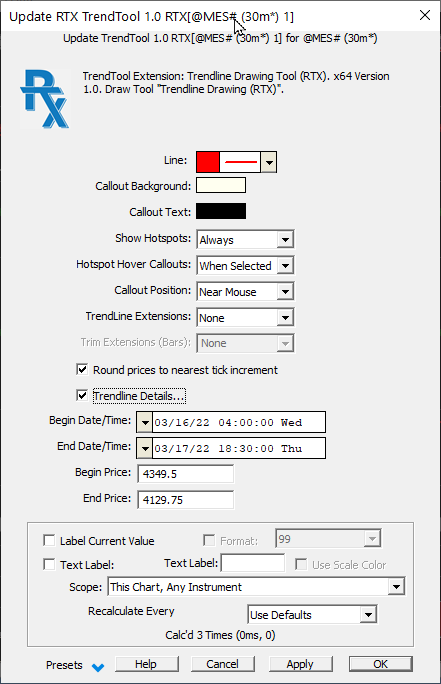
TrendTool has the option to show extensions of the line forward in time from the end point, back in time from the begin point, neither, or both. When extensions are enabled, the extensions are drawn as far as the can be to an edge of the chart window. Alternatively, there is a setting in the preferences for trimming the extensions to some number of bars. When a trendline is draw as a solid line, extensions are drawn instead as a dotted line of the same color. This makes it clear, at either end point, where the trendline ends and the line's extension(s) begin. When a trendline is drawn as a dotted line or dashed line, it will always have minimal width of 1 and the extensions are drawn as a solid line to contrast with the actual trendline.
If the end of a trendline has an extension, the drag and drop operations that begin on the extension portion of the line are treated as a drag of the end point to a new position. In other words, to drag the end point of a trendline, you can mouse down on the ending hotspot or on any point along that line's extension to select and/or begin a drag and drop of that end point. This is very useful if you have two or more trend lines that begin or end at the same spot. With extensions enabled, this makes it easy to select or drag the end point of the line you want by beginning the drag on the extension.
When using the TrendTool drawing tool to create a new trendline, if you drop the end point beyond the last bar in the chart, the line's precise slope is determined and the trendline's end point will become the last bar. When dropping a new line beyond the last bar, TrendTool automatically ensures that extensions into the future are enabled so the extension line will appear (beyond the last bar) precisely where the drop occurred.
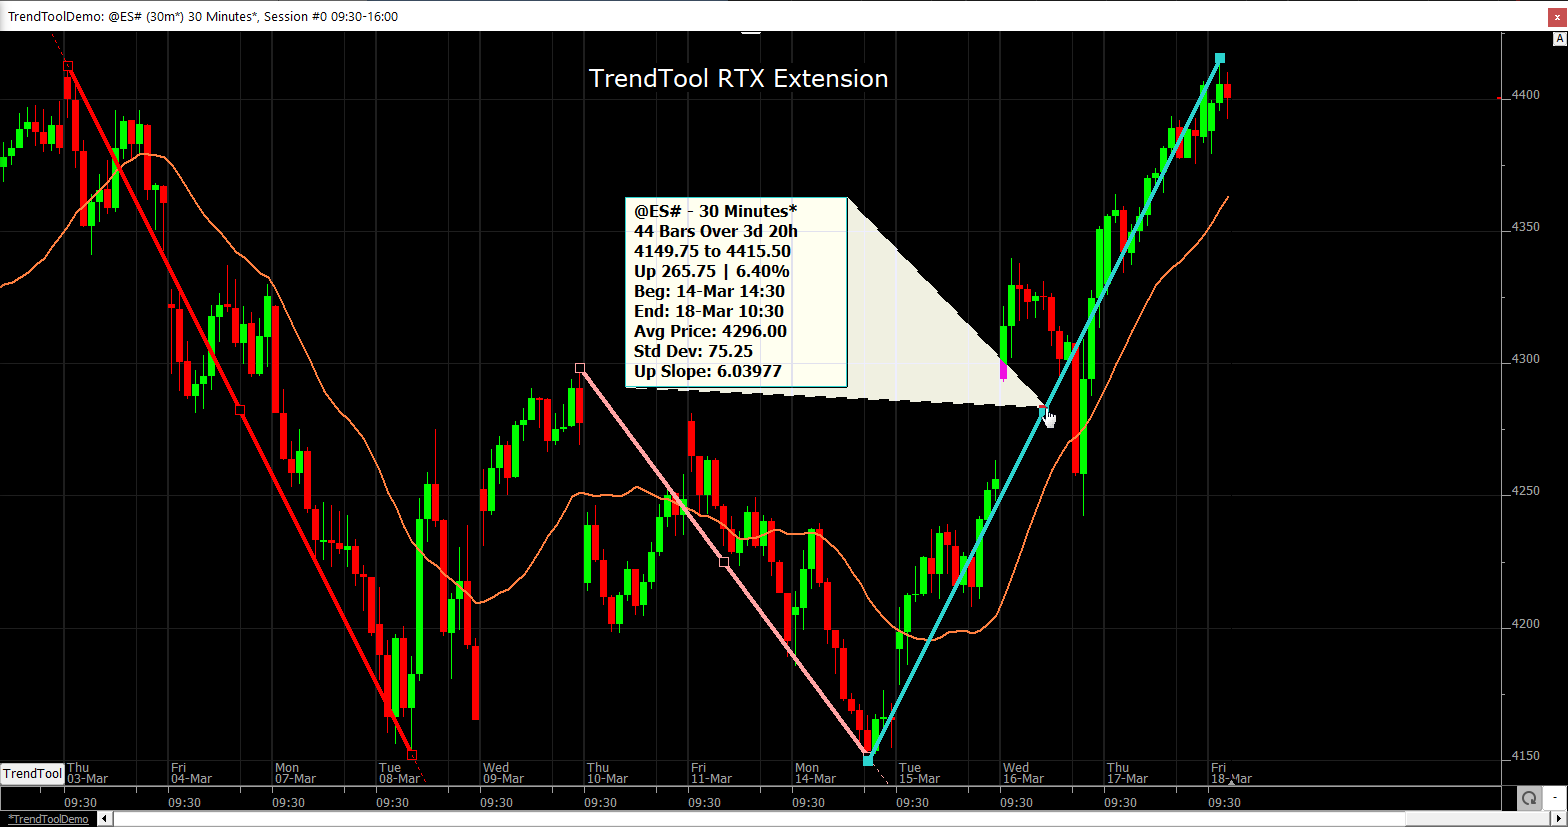
Hovering the mouse pointer over any of the three hot spots optionally displays a call out box showing details about the trend line and the range of bars that the trendline spans. It is a user preference whether these callouts appear. Choices include always or never; only when the trendline is selected when you hover, or only when hovering over a hotspot with the shift key held down. The Callout box shows the following:
- The symbol and periodicity
- The number of bars from the begin to the end point of the line
- The distance in time between the begin and end of the trendline
- The price change and %change in price (plus or minus) from the begin point to end point.
- The average closing price of the bars spanned by the trendline
- The standard deviation of closing prices during the trendline span.
- The slope of the trendline, plus or minus, expressed as the ratio of change in price and the number of bars in the trendline, i.e. the average change in price per bar over the trendline span.
The positioning of the callout box is a user preference. When enabled, callouts can appear near the hotspot where the mouse is hovering, or at any corner of the chart pane in which the trendline resides. When a trend tool line is selected and the mouse is positioned over a hotspot, you may press the letter P (P as in Position) repeatedly to change the position of the callout box for that particular trendline.
There are two ways to duplicate an existing trendline, retaining its slope.
- Use drag and drop. Mouse down within the line (not on its end points) and hold down the Ctrl-key as you drag the line to a new position. When you drop the trend line with control key down, Trendtool will duplicate the existing trendline at the dropped location. The new trendline becomes selected so that keyboard shortcuts can immediately be used to adjust it color, line width, etc.
- Use Copy/Paste. Select the line you wish to duplicate; press Ctrl+C to copy the selected line to the clipboard; press Ctrl+V to Paste. The duplicated trendline will appear offset a few ticks increments below the original. The new line becomes selected for keyboard adjustment as is does with the drag and drop method. For example, you can duplicate an existing red trendline by selecting it and pressing Ctrl+C,Ctrl+V,G,2 to produce a green duplicate, 2 pixel line, offset from the original red one. The copy/paste method can be performed using the mouse alone. Right-click on a trend tool line and choose Copy from the menu; then right click again and choose Paste. Note that then you paste, the original trendline remains on the clipboard so you can paste as many times as you wish to make as many duplicates as you wish.
We hope you enjoy using this new RTX drawing tool. If you find that you prefer using TrendTool instead of the built-in trendline indicator, the configuration variable, RTXTrendLineTool, can be set in File > Preferences > Configuration to instruct the charting platfrom to invoke TrendTool when you use the chart toolbar to draw trend lines. If you elect to make TrendTool your preferred trendline drawing tool, you can still invoke the Trendline indicator drawing tool by right-clicking in any chart and using the Draw submenu.
Presentation
Keyboard Adjustment
Trendtool has many keyboard shortcuts available when a trendtool line is selected.
- ROY G BIV is an acronym for the sequence of hues commonly described as making up the colors of a rainbow: red, orange, yellow, green, blue, indigo and violet. These letters ROYGBIV are keyboard shortcuts for changing the line color. The letter K is the shortcut for black, and W is the shortcut for white, Letter L is also available for Lime, preferable to Green for very dark chart backgrounds. The letter C (C as in color) pressed repeatedly, cycles the selected line's color through a list of common colors, ROYGBIV and others.
- Strike a number key to change the line width to that number. 1 through 9. The 0 key or period key can be pressed to obtain a dotted line. Notice that as the line thickness increases so does the hotspot box size.
- The hyphen(minus) changes the line to dashed, and the equals key makes the line solid again. Zero, Hyphen, and equal are adjacent keys at the upper right row on the keyboard. The shortcut letter 'D' (D as in dotted/dashed) cycles the trendline from solid to dotted to dashed.
- The arrow keys move the line up/down/left/right, retaining the same slope.
- With shift key down, left arrow extends the length of the line leftward, shift right arrow key extends the length forward in time by one bar.
- When the mouse is hovering over a hotspot with callouts enabled, press the letter P (P as in Position) repeatedly to cycle the position of the callout box for that particular trendline.
- Press the letter E repeatedly (E as in Extensions) to cycle trendline extensions on/off for the selected trendline
- Press the letter C repeatedly (C as in Color) cycles the selected line through various color hues.
TrendTool supports the Chart Button indicator to enable chart buttons to control various settings. Setup Buttons with purpose RTX Event and select the TrendTool event name. TrendTool supports these button events. When such a button is clicked upon, RT will apply the button event to the currently selected TrendTool line. If there is no line selected, the event will apply to the first TrendTool line found in the chart.
- Cycle Color
- Cycle Line Width
- Cycle Line Style
- Cycle Line Extensions
- Cycle Extension Trim
- Cycle Call Out Position