Bollinger Bands are volatility based bands used to help identify situations where prices are too high, or too low, on a relative bases. When prices reach or rise above the upper band, they are too high. When prices reach or drop below the lower band, they are too low. Bollinger bands are calculated by first smoothing the typical price using the MA type and period specified. The typical price for each bar is defined as (high + low + close)/3. The standard deviation is then calculated for the series of typical prices. The same period used for smoothing the data is also used for calculating the standard deviation of typical price. Trading bands are then drawn at some user-specified multiple of standard deviations above and below the center smoothed typical price line. Market reversals often occur near the upper and lower bands. Bollinger recommends using a Simple 20 period moving average, on a typical price of HLC/3, and with bands at 2 standard deviations. High values of bandwidth represent regions of high volatility, while low values of bandwidth represent regions of low volatility.
Presentation

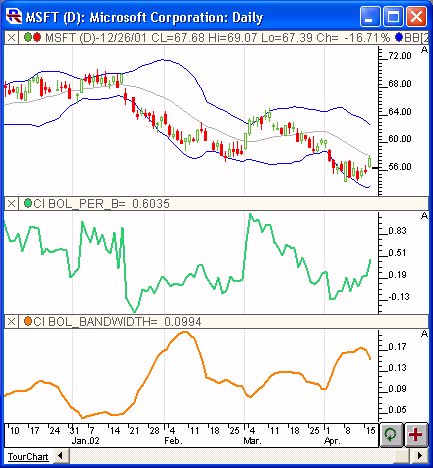
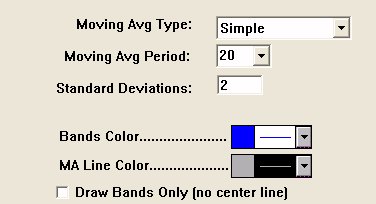
Above is a Daily Candlestick Chart of Microsoft Corporation (MSFT). The blue bands in the upper chart pane represent the Bollinger Bands created using the preferences specified below. The gray center line represents the average typical price off which the Bollinger Bands are based. In the middle pane, a custom indicator is charted in green, representing the Bollinger %b line. In the lower pane, another custom indicator is charted in orange, representing the Bollinger Bandwidth. Both of these custom indicators will be discussed further below.
Formula
Keyboard Adjustment
The MA Period and the Standard Deviations involved in the Bollinger Bands indicator can both be adjusted directly from they keyboard without opening up the preference window. First, select the indicator, then use the up and down arrow keys to adjust the MA Period up or down by 1. To adjust the Standard Deviation multiple hold down the shift-key while hitting the up and down arrows. The Standard Deviation multiple will be adjusted in increments of 0.10.


