Stochastic is a momentum or price velocity indicator developed by George C. Lane.
Stochastic measures the position of a stock compared with its most recent trading range over the period specified (Raw K period). Specifically, it measures the relationship between the closing price of a stock and its high and low during a specific number of bars (minutes, days, weeks, etc). As a stock price rises, the closing price tends to be closer to the extreme highs of the stock, and as prices fall, the closing price tends to fall closer to the extreme lows. This raw stochastic value is called Raw K. The Raw K is then smoothed with a simple moving average (using the Fast D period specified) to produce the Fast D. A second simple smoothing can then be performed on the Fast D to produce the stochastics Slow D value. Stochastics values indicate overbought and oversold regions.
Mathematically, the Raw K stochastic indicator is calculated as follows: Raw K = 100 * [CL - MIN(LO, n)] / [MAX(HI, n) - MIN(LO, n)] where n = Raw K Period The Raw K line is then smoothed with a simple moving average to yield a Fast D line. The Fast D line is optionally smoothed again with a simple moving average to yield a Slow D line.
Fast D = MA(Raw K, Simple, Fast D Period) Slow D = MA(Fast D, Simple, Slow D Period) The Fast D value (single-smoothed raw stochastics) represents the value most people are referring to when they mention Stochastics. When the Fast D crosses above the 75 line, this is considered overbought condition and a possible selling opportunity. The closing price is near the top of the recent trading range and a correction could be coming. When the Fast D starts falling, the top may have been established, and a new downtrend is considered when the Fast D indicator crosses the below the 75 line When the Fast D crosses below the 25 line, this is considered oversold condition and a possible buying opportunity. The closing price is near the bottom of the recent trading range and a correction could be coming. When the Fast D starts rising, the bottom may have been established, and a new uptrend is considered when the Fast D indicator crosses above the 25 line.
Price trend reversals can be signaled when the Fast D line diverges from price. That is, when price makes a new high while Fast D is falling, a change of trend to the downside is indicated. If price makes a new low with Fast D rising, look for a reversal to the upside. Actual buy/sell signals are indicated when the Fast D line crosses above (buy) or below (sell) the Slow D line.
Signals are also produced when the Fast D crosses it's moving average (the Slow D). A buy signal is given when the Fast D crosses above Slow D, and a sell signal is given when the Slow D moves above Fast D.
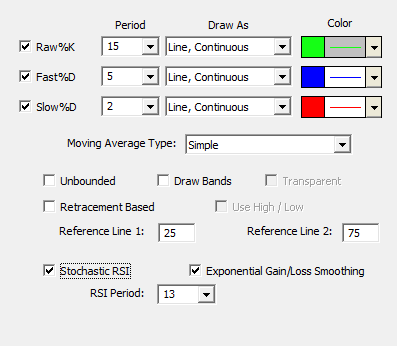
The classic Lane Stochastic calculation method dictates that the RawK represent the position of current price in relation to a recent range. This position is measured as the percentage of the distance from the low to the high. If the low of the period was 50 and the high was 70, then a current price of 65 would represent RawK of 75% while a current price of 55 would represent a RawK of 25%. From a retracement perspective, Stochastic always assumes that the high occurred first, the trend was a downtrend, and retracement is now occurring back towards the high. The RawK of the Stochastic indicator is not smart enough to know which came first, the high or the low. The “Retracement Based” checkbox in the Stochastic preferences gives the RawK value this knowledge, and therefore results in a value that represents the true retracement percentage based on the RawK period specified. This option is very similar to the “auto-retracement” option of the Fibonacci Retracement study, except it gives the ability to view the values historically, and to reference them historically in the RTL language.
When the Unbounded Stochastic box is checked, the RawK values are allowed to go outside the 0 to 100 boundaries imposed by the standard stochastic indicator. The RawK is computed as a relative position of the closing price within the range of the "previous" n bars (n being the RawK period). The only difference being that the range of the unbounded stochastic does not consider the current bar, thus allowing the close to go outside of that range. The standard stochastic indicator includes the current high and low in it's calculation of that range, thus never allowing the closing price to exceed the bounds of that range (since it must lie between the high and low of current bar). The difference between the calculations can be seen in the expressions below: Standard Stochastic Raw %K = 100 * [CL - MIN(LO, n)] / [MAX(HI, n) - MIN(LO, n)] Unbounded Stochastic Raw %K = 100 * [CL - MIN(LO.1, n)] / [MAX(HI.1, n) - MIN(LO.1, n)] The unbounded stochastic provides additional information as to the strength of the move/trend that the standard stochastic can often hide. The unbounded option makes it easy to spot strong breakouts with values below 0 or above 100.
The Retracement Based option turns the RawK into a retracement percentage from the last extreme. For instance, for a 10 period RawK with Retracement Based turned on, the result will be positive if we last hit the low and equivaent to the retracement percent of the closing price when retracing off high towards low. If we last hit the high of the 10 bar period, then the value will be negative and equal to the retracement of the closing price of the bar as a percentage move from the high down towards the low. So a value of -25 means we last hit the high of the recent period and the close of this bar is 25% of the way into the high/low range from the high. A value of 30 would tell us we last hit the low and the closing price of this bar is 30% of range off the low. When "Use High/Low" is unchecked, the high and low of the recent period is computed using only the closing prices of the bars and does not consider the high and lows of the bars.
Presentation

Formula
Keyboard Adjustment
Several preferences of the Stochastics indicator can be adjusted directly from the keyboard without opening up the preference window. First, select the indicator, then use the up and down arrow keys to adjust the Raw K period up or down by 1. To adjust the Fast D period, hold down the shift-key while hitting the up or down arrow keys. To adjust the Slow D period, hold down the ctrl-key while hitting the up or down arrow keys.