Boundaries (RTX)

The Boundaries RTX extension is designed to allow the user to manually identify and mark boundaries (bars or date/times) that can then be used effectively by other indicators such as the
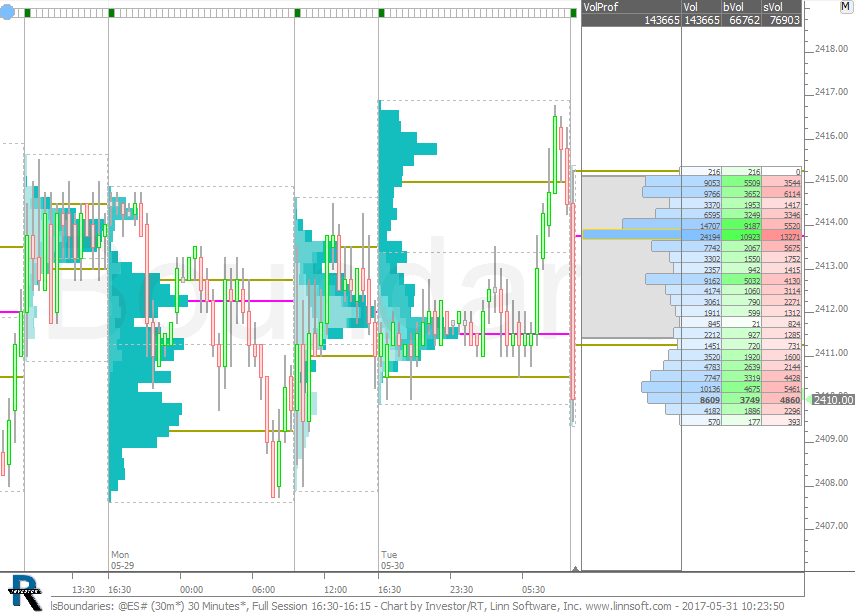
 Profile Indicator and the Price Statistics Indicator. 
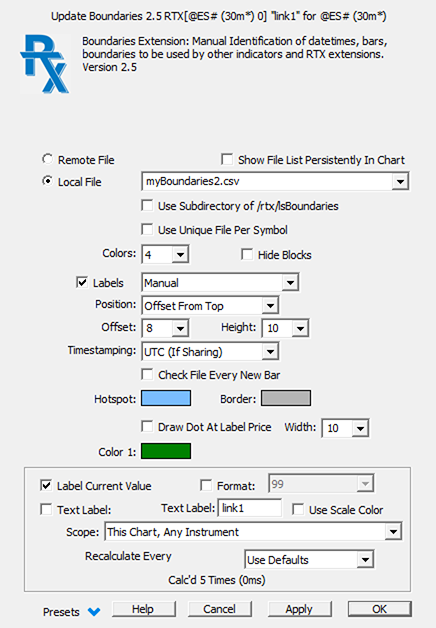
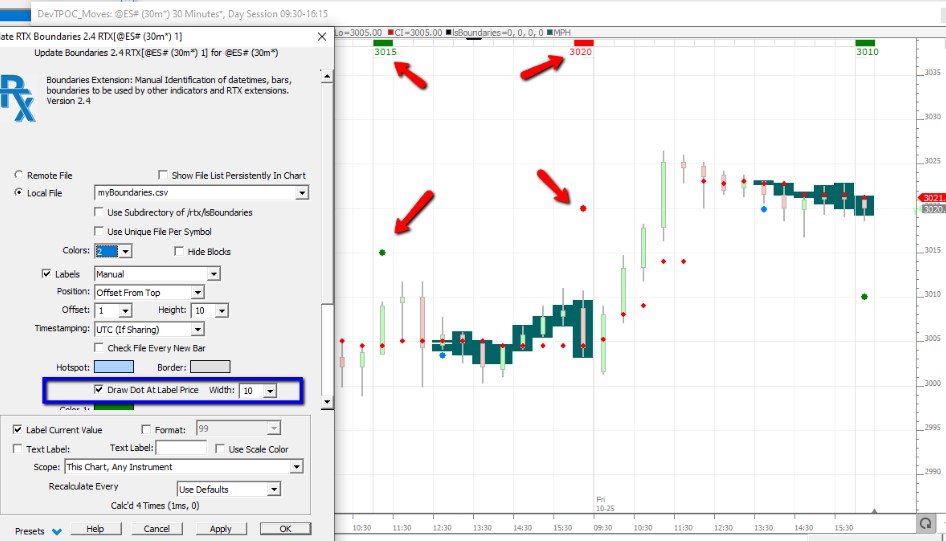
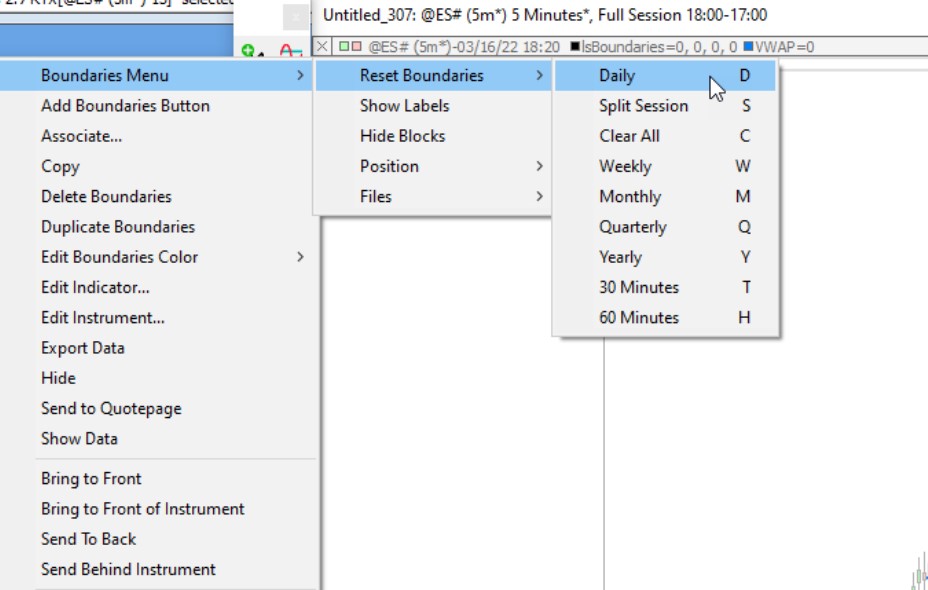
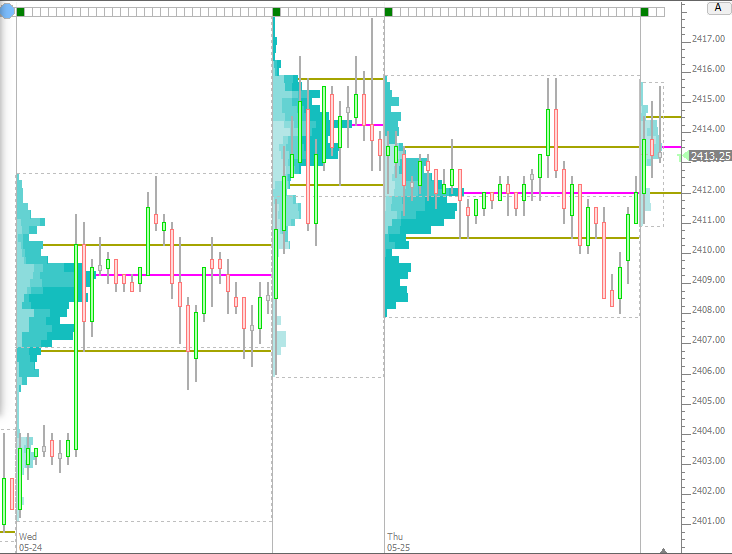
Visually, a boundary is indicated by a horizontal strip at a user-specified height upon which user can click to mark or unmark any bars as the start and/or ending boundary. An instance of the Profile Indicator can sense the Boundaries to provide the starting and ending bars for multiple profiles and facilitate splitting and merging profiles. Boundaries can provide the Price Statistics Indicator the start and/or end bar on which to compute statistics. The Boundaries extension can handle an unlimited number of boundaries (date/times), and stores it's information in a csv file. The csv file is updated as the user makes changes to the visual boundaries in the chart. The file can be manually updated. It can be shared with other Investor/RT users via a server. The extension provides an option to use a local file, or to obtain boundaries from a file hosted remotely via http. Shared files allow a single user to maintain the boundaries of profiles and easily share those boundaries with a group of fellow Investor/RT users. Please view the Boundaries Introduction video for instructions on using this extension effectively in your charts.
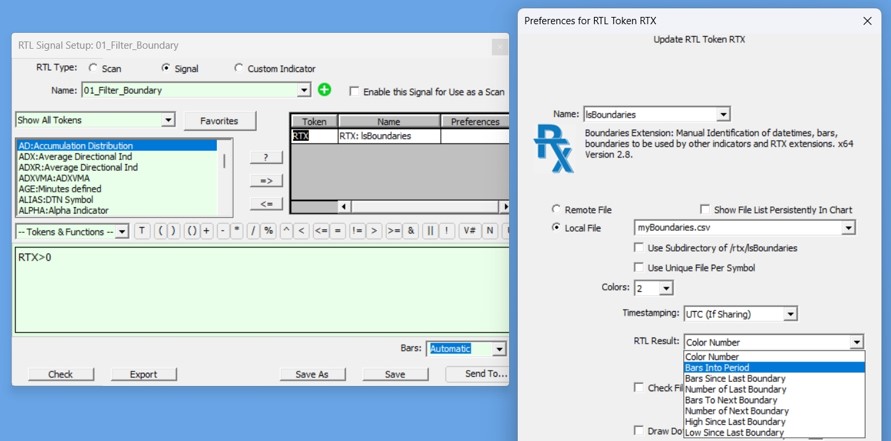
Presentation

Keyboard Adjustment

The Boundaries horizontal strip may be moved up and down by selecting the Boundaries (click on hotspot on left) and then use the up or down arrow keys or mouse scroll-wheel.

Boundaries Prefs

  • Remote/Local File - Location of the .csv file where the boundaries are stored.  When Local File is specified, the filename provided will be placed in the Admin folder withing the InvestorRT User folder.  When Remote File is specified, the file will pulled from the url provided.  Boundaries may edited in the chart only when Local File is used.  When Remote File is specified, the user is in a "read-only" mode relying on the remote source file for the boundaries.
  • Colors - Number of Colors.  Most common selections will be 1 or 2 colors.  When 1 color is specified, all clicks on the Boundary blocks will toggle the start boundaries on/off.  This would be a common setting for feeding profiles and providing easy merge/split ability.  In order to allow for ending profiles on bars other than the one proceeding where the next one starts (in other words, allowing for bars between profiles), choose 2 colors.  Often the color green will be used for color 1 (start boundaries) and red will be used for color 2 (end boundaries).  Up to 8 colors may be specified, each with option to have it's own custom label.
  • Hide Blocks - When checked, this option hides the blocks of Boundaries horizontal strip in the chart.  This option can be toggled on/off with the Boundaries menu that is accessible by right-clicking on the Boundaries hotspot.
  • Labels - Label options include Manual and Auto (Per Color).  When Manual is chosen, and Local File is in use, the user may click below an active colored boundary (within 12 pixels below) and will be prompted for a label for that Boundary.  When Auto is specified, each color can be assigned it's own unique label.
  • Position - Options to position the Boundaries at the top or bottom of the chart at a user specified offset (in pixels).
  • Height - Height of the Boundaries blocks / horizontal strip (in pixels)
  • Timestamping - The Timestamps can be stored in the Local csv file in either UTC or Local time.  Using UTC timestamps is especially important if the csv file will be shared with others in different timezones.  By using UTC, the Boundary datetimes will translate no matter what timezone the recipient is in.
  • Hotspot - Color of the hotspot dot on the left side of the Boundary horizontal strip.
  • Border - Border color used for both the blocks in the horizontal strip, and the hotspot.
  • Color 1, Color 2, ... - Colors and Labels (if applicable via Auto Labels) of the number of colors specified above.
lsBoundaries (@ES#)
lsBoundaries RTX Indicator. This chart was uploaded by Investor/RT 12.7.4 showing symbol: @ES#.

Read more Download

Pop-up Video Description View
Boundaries (RTX) Introduction

The Boundaries indicator is designed to allow user to manually identify and mark boundaries (...

 Watch