Boundaries

CP AP DailyTPOVolProfiles (@ES#)

Charts showing both TPO Profile (on the left) & Volume Profile (on the right), together with the merging/hiding profile features offered by the Boundaries indicator.
This chart was uploaded by Investor/RT 15.1.12 showing symbol: @ES#.

Boundaries (RTX) Introduction

Boundaries (RTX) Introduction

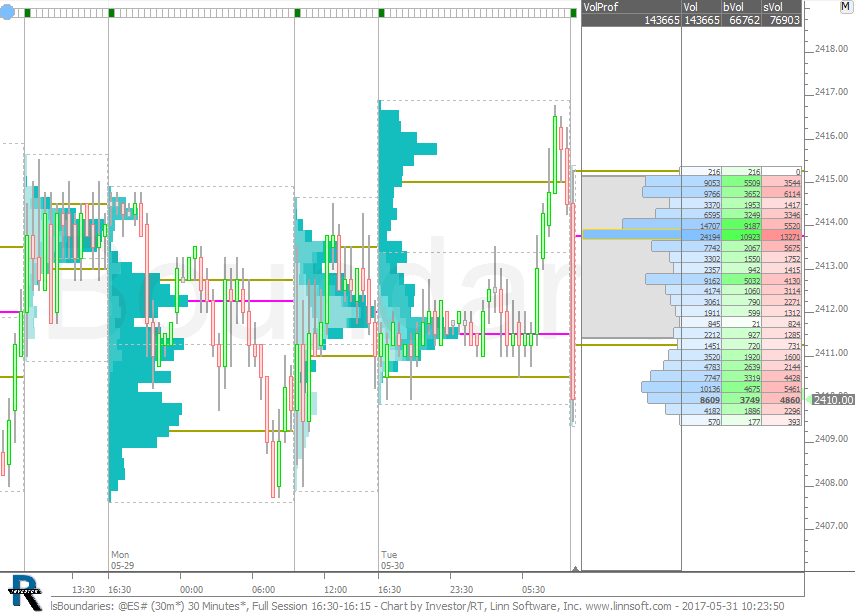
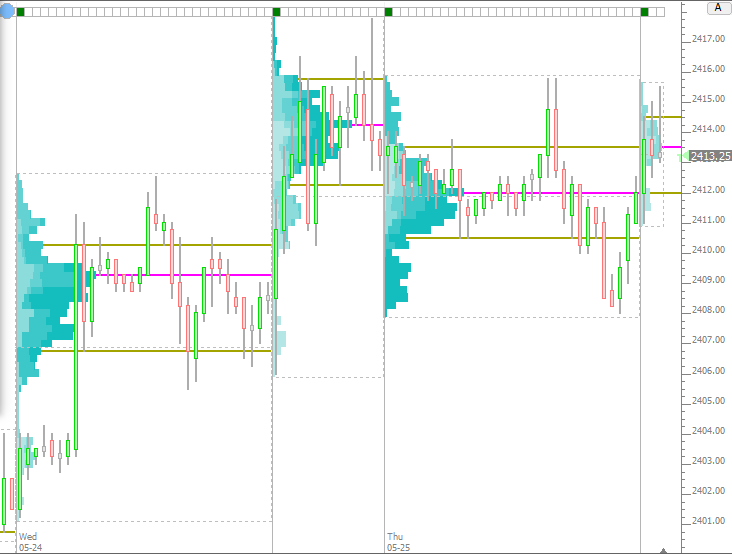
The Boundaries indicator is designed to allow user to manually identify and mark boundaries (bars or date/times) which can then be used effectively by other indicators such as the Profile Indicator and the Price Statistics Indicator. Visually, the Boundary Indicator is a horizontal strip at a user-specified height upon which user can click to mark or unmark any bars as the start and/or ending boundary. A single instance of the Profile Indicator can feed off the Boundaries to provide the starting and ending bars for multiple profiles and facilitate splitting and merging profiles.

Boundaries (RTX)

The Boundaries RTX extension is designed to allow user to manually identify and mark boundaries (bars or date/times) that can then be used effectively by indicators such as the Profile and Price Statistics Indicator. Visually, the Boundary extension is a horizontal strip at a user-specified height upon which user can click to mark or unmark any bars as the start and/or ending boundary.