The Directional Indicator is a momentum indicator which attempts to quantify the trending or directional behavior of a market. It is one of the best trend following indicator in technical analysis. It helps identify trends and whether or not price is moving quickly enough to be worth a long or short play. It also helps traders take a nice profit out of the middle of significant trends. Directional Indicator is defined as the largest part of the current period price range which lies outside the previous period price range. If the larger excess is above the previous period high, it is considered a Positive Directional Indicator, or +DI. If the larger part of the current range is below the previous period low, it is considered a Negative Directional Indicator, or -DI. These values are summed and smoothed using the method described in the formula above. Consider the +DI to measure the percentage of up movement and -DI to measure the percentage of downtrend. When the +DI rises above the -DI, it is a bullish signal. A bearish signal occurs when the +DI falls below the -DI. When an instrument is in a trading range, these DI crosses can produce whipsaws. Wilder recommends the following extreme price method to help avoid these whipsaws. Identify an trigger point at the extreme price on the bar the lines cross. If it's a bullish crossing (+DI cross above -DI), you would wait for the price to rise above this extreme price (the high price on the day the lines crossed). If it's a bearish crossing (+DI crosses below -DI), the extreme point is defined as the low price on the day's the lines cross.
+DI and -DI are components in the calculation of the ADX (Average Directional Movement) and ADXR (Directional Movement Rating) indicators. ADX and ADXR help confirm signals generated by DI crosses.
See Also the True Range Indicator.
Presentation

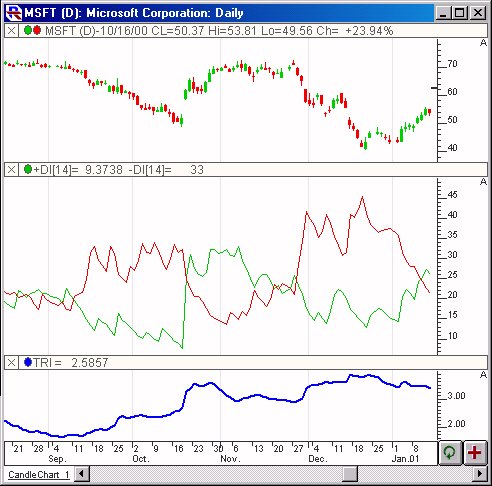
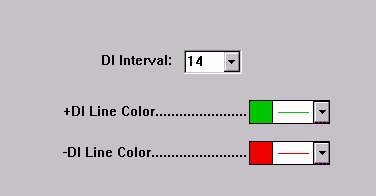
Above is a Daily Candlestick Chart for the Microsoft (MSFT). The Directional Indicator is seen in the middle pane, with the True Range indicator in the lower pane.. The +DI is seen in green, with the -DI seen in red, as specified in the preferences below. Both the Direction Indicator and the True Range are using a period of 14.
Formula
Keyboard Adjustment
The Direction Indicator Interval can be adjusted directly from they keyboard without opening the preference window. First, select the indicator, then use the up and down arrow keys to adjust the interval up or down by 1.


