Bar Lines

The Horizontal Reference line tool has an option entitled "Bar Lines". This option gives the user an automated tool that draws horizontal reference lines at 6 levels: current open, current high, current low, previous open, previous high, previous low. This option comes with a periodicity control that dictates the periodicity of the bars used to determine the current and previous levels. For instance, if you specify a periodicity of "Daily", then your previous open will be the open of the previous day, and your current high will be the high of today. If you specify a periodicity of 30 minutes, then your previous low will be the low of the previous 30 minute bar, while your current open will be the open of the current 30 minute bar. Each horizontal reference line is labeled with a description and value. (e.g. 33.75 PrevOp) This option also comes with an additional color, allowing the user to specify a different color for current versus previous lines.

Presentation

barLinesChart

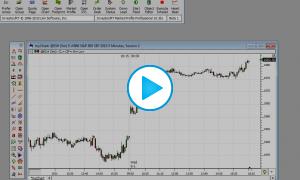
Above is a 10-minute chart of the Microsoft (MSFT). The BarLines are drawn as horizontal reference lines in red and blue. The blue lines represent the High, Low, and Open of the previous day, while the red lines represent the High, Low, and Open of the current day.

barLinesPrefs

  • BarLines-This turns on the BarLines option inside the Reference Line tool. This results in 6 lines, at the High, Low, and Open of the current and previous day. The lines for the current high and low are dynamic. The previous lines will be drawn in the color right of the bar lines, while the current lines will be drawn in the color at the bottom of the dialog. Actually, the BarLines aren't limited to daily periodicity. Any periodicity may be specified. For instance, if 60-minutes is chosen as the periodicity, then the current lines will draw at the high, low, and open of the current 60-minute bar, while the previous lines will draw at the high, low, and open of the previous 60-minute bar. IMPORTANT NOTE: If your chart is an intraday chart, and you want the BarLines to reflect daily values, AND to reflect the SESSION OVERRIDE that you've assigned to that chart (for instance, your symbol may be set to the 24 hr session 31, while the chart is set to the RTH session 2), then just setup the BarLines with a periodicity of "1000 minutes" (instead of daily). This will result in BarLines reflecting the RTH daily values. If you specify a periodicity of "Daily" for the BarLines, then the daily bars on the database will be used (those seen in a daily bar chart), and that is not always what is desired by the user. This will only work for overriding sessions which span 1000 minutes or less (session 0 spans 390 minutes, session 2 spans 405 minutes, but session 31 spans 1425 minutes and there are 1440 minutes in a day).
No examples. Let us know if you'd like to see one added.
Pop-up Video Description View
Bar Counts

This video will answer a questions asked on the Yahoo discussion list regarding starting a bar...

 Watch