Price Statistics
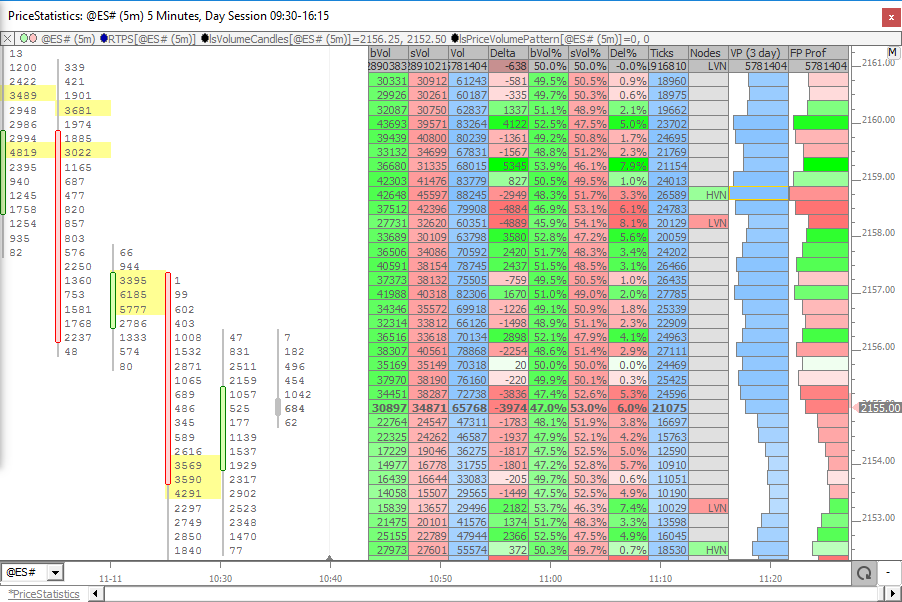
The Price Statistics Indicator presents cumulative volume based information textual for each price over any user-specified period of time (days or bars).
The Price Statistics Indicator presents cumulative volume based information textual for each price over any user-specified period of time (days or bars).
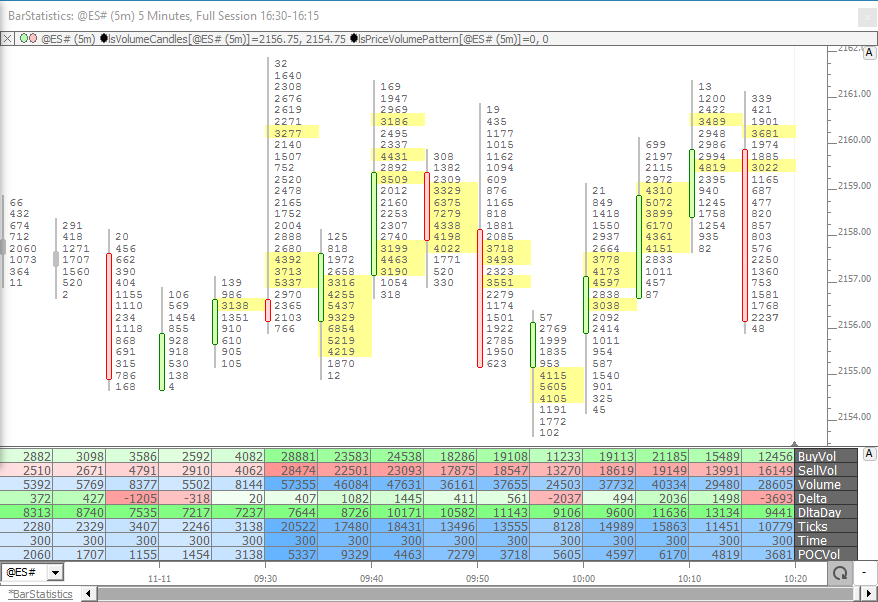
The Bar Statistics Indicator presents cumulative volume based information textual for each bar.
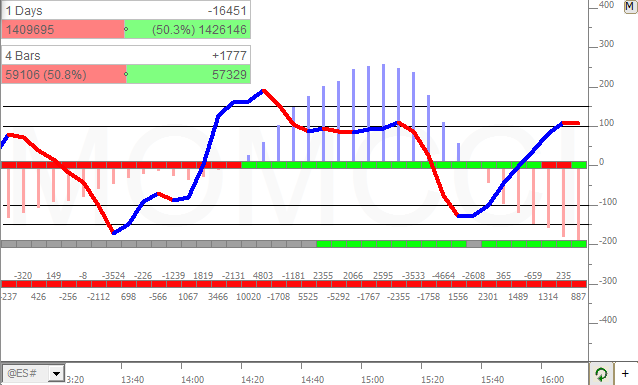
The BuySellMeter extension displays the buying volume versus the selling volume for a user-specified period of time expressed as a number of days or number of bars. Buying volume is defined as volume that traded at the ask/offer price; selling volume is defined as volume traded at the bid price. BuySellMeter provides a nice visual of these two volume metrics in a compact box that may be positioned anywhere in the chart. The horizontal and vertical position of the box (in pixels from top left) may be entered in the indicator preferences, or you can drag and drop the box using the mouse. The position can be fine tuned by clicking inside the box to select it and then using the keyboard arrow keys.
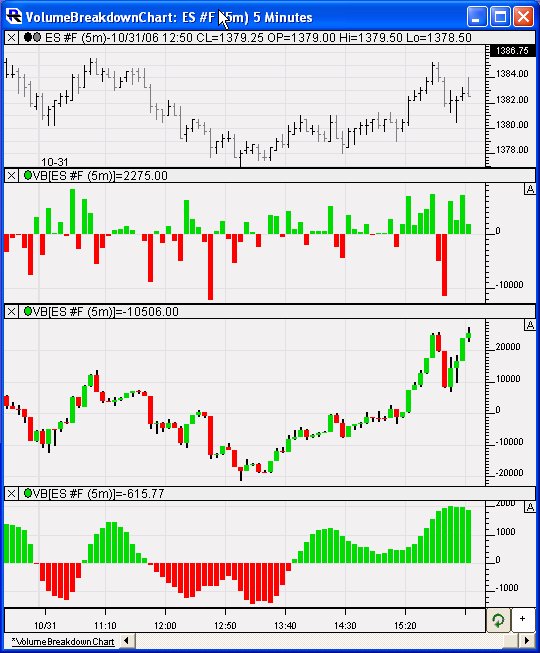
The Volume Breakdown is a powerful and flexible indicator used to gauge buying and selling pressure. It looks inside each bar, breaking down and classifying each tick and then accumulating the results (accumulation is optional), and further giving the user a variety of statistical measures (including all built-in technical indicators) to apply the these results. The most common use of the VB indicator is to calculate the delta (difference between the buy (ask-traded) and sell (bid-traded) volume) of each bar. Positive deltas signify more buying pressure, while negative deltas signify more selling pressure. The magnitude of the delta determines the strength of that pressure. Expect to see positive deltas during uptrends and negative deltas during downtrends, but look for delta turning negative at highs, or turning positive at lows...a sign of possible market turns and good entry/exit points.