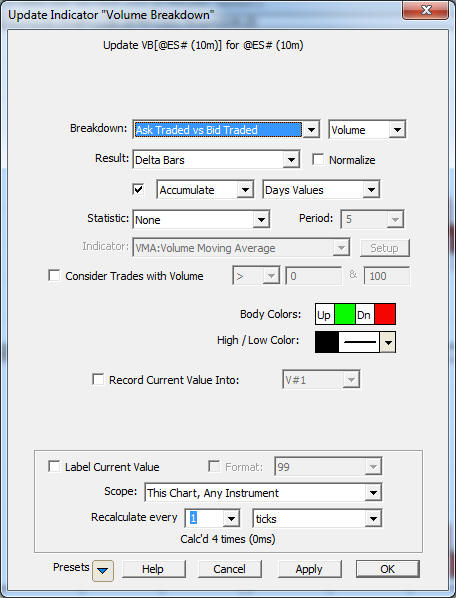
The Cumulative Delta is an option within the Volume Breakdown Indicator (VB). The most common VB setting for cumulative delta is to accumulate the days/sessions values and draw as "Delta Bars" as seen below.
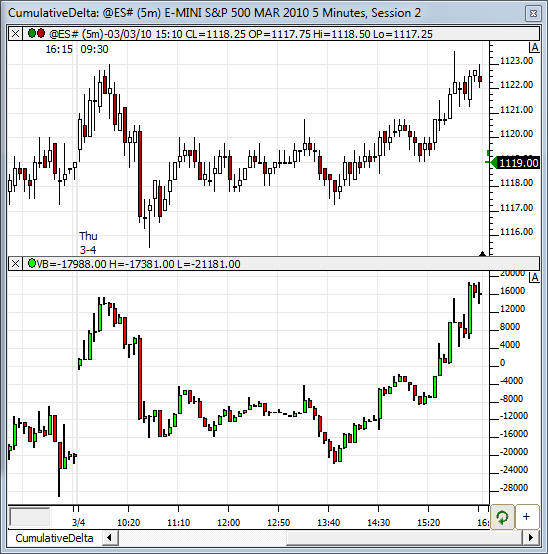
The result is a set of candlesticks representing the cumulative delta for the session, building from zero at the start of each session, as seen in the bottom pane of the chart below
Some users prefer to accumulate all data instead of resetting the delta calculation to zero at the start of each session. For those that accumulate all data, this videoon plotting lines between bars will be useful as it shows how to snap those lines to the highs or lows of the VB candles.