Premium

Volume Breakdown (VB)

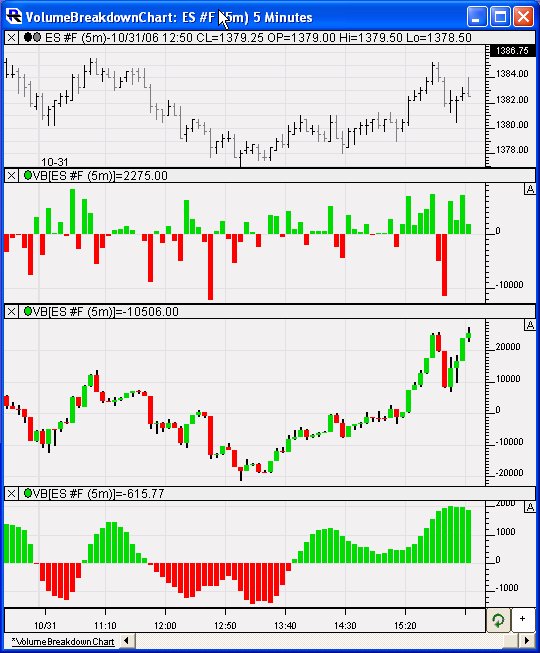
The Volume Breakdown is a powerful and flexible indicator used to gauge buying and selling pressure. It looks inside each bar, breaking down and classifying each tick and then accumulating the results (accumulation is optional), and further giving the user a variety of statistical measures (including all built-in technical indicators) to apply the these results. The most common use of the VB indicator is to calculate the delta (difference between the buy (ask-traded) and sell (bid-traded) volume) of each bar. Positive deltas signify more buying pressure, while negative deltas signify more selling pressure. The magnitude of the delta determines the strength of that pressure. Expect to see positive deltas during uptrends and negative deltas during downtrends, but look for delta turning negative at highs, or turning positive at lows...a sign of possible market turns and good entry/exit points.

Trading System Indicator (TSYSI)

The Trading System Indicator (TSYS) charts the actions of a Trading System built using the Investor/RT Trading System Tools. The TSYS can operate on bars of any periodicity, both historically (backtesting) and going forward. TSYS clearly marks all position changes, whether it be an entry, an exit, a reversal or an addition or reduction of an existing position. Stepped lines are optionally drawn on every bar in every trade, to show the entry price, stop/trailing stop price, target price, and more. An optional trade box can be wrapped around every trade. Since Trading Systems can use multiple signals/rules to manage the behavior of the system over time, this indicator is much more powerful than a single Signal Marker or combination of Signal Markers. The Trading System allows each signal/rule to have knowledge of the current condition of other signals, as well as the current characteristics of the overall system.

TPO Indicator (TPO)

The TPO Indicator computes and displays historical values for TPO Profile price levels: POC, Value Area High (VAH), Value Area Low (VAH), developing POC, VAH, and VAL. It enables review these values historically to see see how price reacted when approaching these levels. While developing POC, VAH, and VAL change throughout the day, traditional TPO Profile charts only show the current values. The TPO Indicator allows the user to look back and see where the levels were at any given historical time. TPO is an acronym for Time/Price Opportunity.

Profile Indicator (PROF)

The Profile indicator enables the user to overlay a price-based profile over a multi-pane intraday chart. The Profile provides a "Price/Row" preference which dictates the height of each row. The width of each resulting row will represent how many bars during the session in which that row's price range was touched. If the periodicity of the chart is 5-minute, and the width of a row is 3 bars wide, then the range of three of the 5-minute bars for that session actually overlapped the price range of that row. The widest row is called the Point of Control (POC). The Value Area (VA) is commonly considered the area in which 70% of the price action transpired. This percent level is adjustable, as some prefer to use alternate VA % levels such as 80%. Options for drawing the current and previous POC and VA lines are provided in the Profile preferences. Another option dictates how many sessions for which the Profile will be computed and displayed. The Profile may be drawn as Solid or Hollow Blocks, Solid or Hollow Ovals, Dots, or Lines. A "Hide Profile" checkbox gives the user the ability to hide the actual profile and draw only current and/or previous POD and VA lines. The "Current" and "Previous" POC and VA lines are also optional, as well as VA and POC labeling.

Pages