JPJ Merged Profile
This chart needs to be assigned to a custom DAX session from 2am EST to 4pm EST. (adjust properly for your time zone)
This chart needs to be assigned to a custom DAX session from 2am EST to 4pm EST. (adjust properly for your time zone)
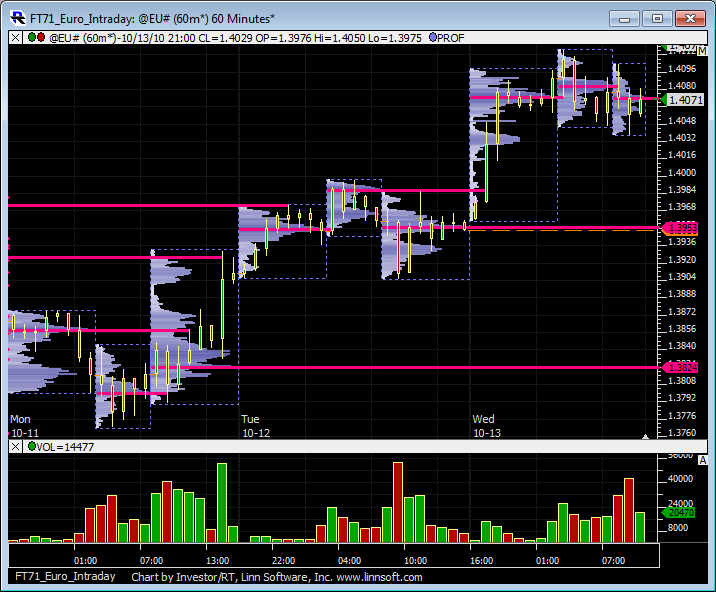
This is a 60-minute candlestick chart of the EuroFX with the split session volume profiles using the Profile Indicator. The Profiles are split into 3 different periods/sessions. The first session goes from 7pm to 3am ET (Tokyo Market, 480 minutes). The 2nd session goes from 3am to 8am ET (London Market, 300 minutes) and the 3rd session goes from 8am to 4pm ET (US Market, 480 minutes). For this chart to work properly, the Euro (@EU# on DTN IQFeed) must be setup with a session from 7:00pm to 4:00pm ET Sun-Fri (adjust times appropriately for your time zone).
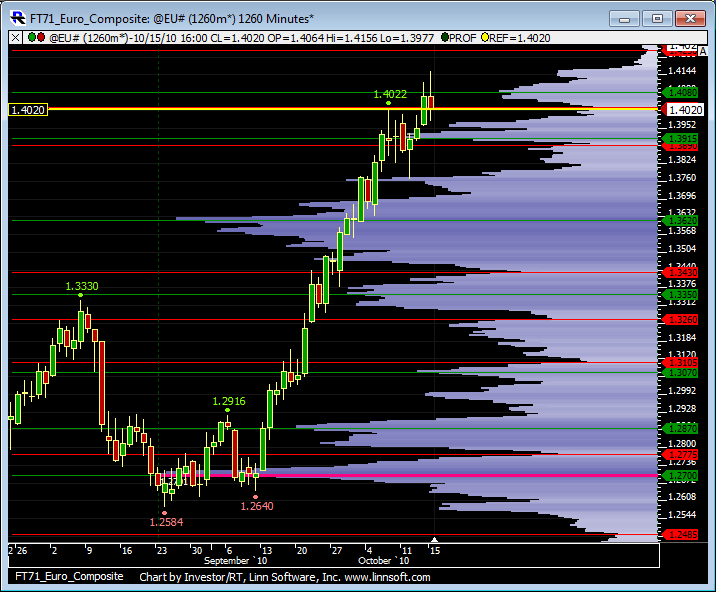
This is a chart of 1260-minute bars of the EuroFX. The 1260-min bars provide pseudo-daily bars of only the day session data. For this chart to work properly, the Euro (@EU# on DTN IQFeed) must be setup with a session from 7:00pm to 4:00pm ET Sun-Fri (adjust times appropriately for your time zone). See Forex Trading Times A composite profile is added to the chart using the Profile Indicator setup with a "Time Per Profile" of "All Bars".
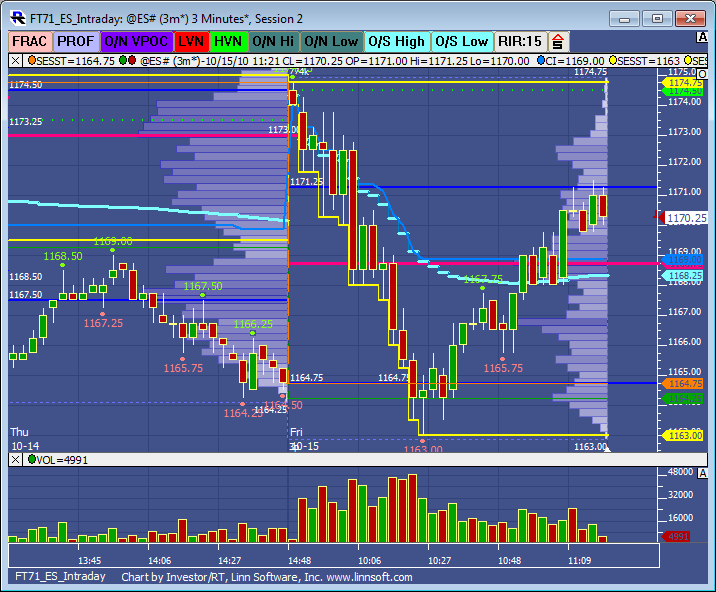
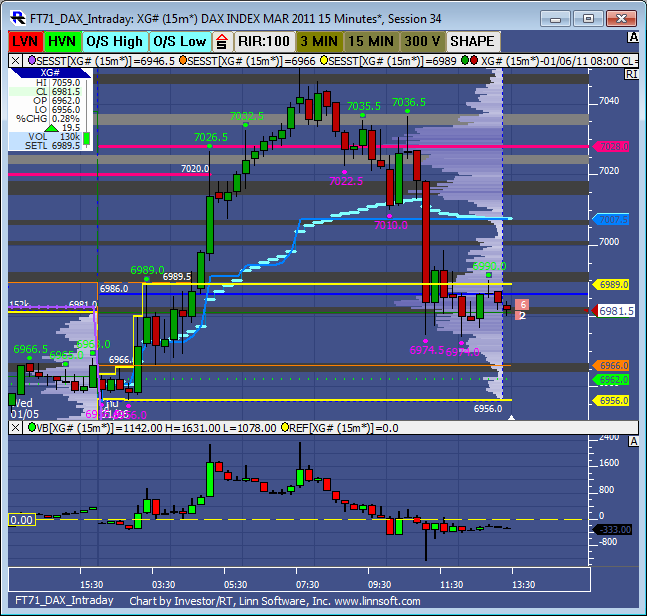
This is a 3-minute candlestick chart of the ES with the day session volume profiles using the Profile Indicator. The Profile Indicator is setup in such a way that, if the user changes the chart to use session 31, the profiles will be split into one profile for the overnight period and another for the day session period. In the lower pane is the per-bar volume. The light blue stepped line is the VWAP. The slightly darker and smaller blue line is the midpoint of the day (this line requires Pro). The yellow lines are the IB high and low (high and low of first 60 minutes).
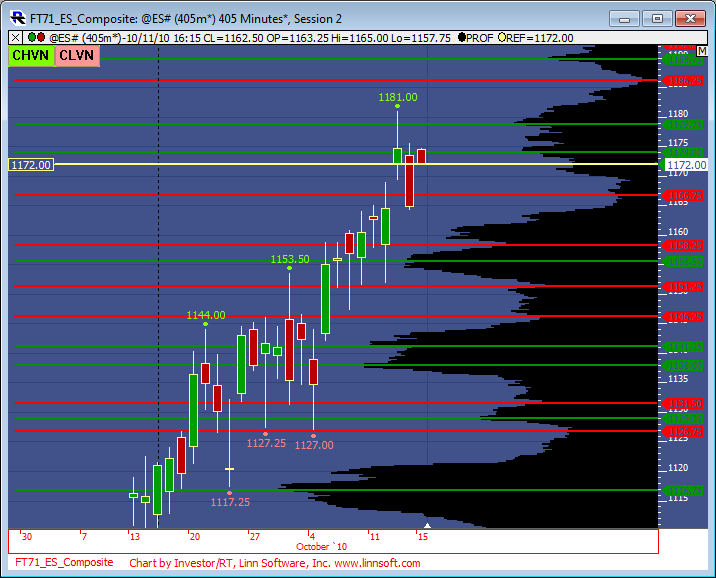
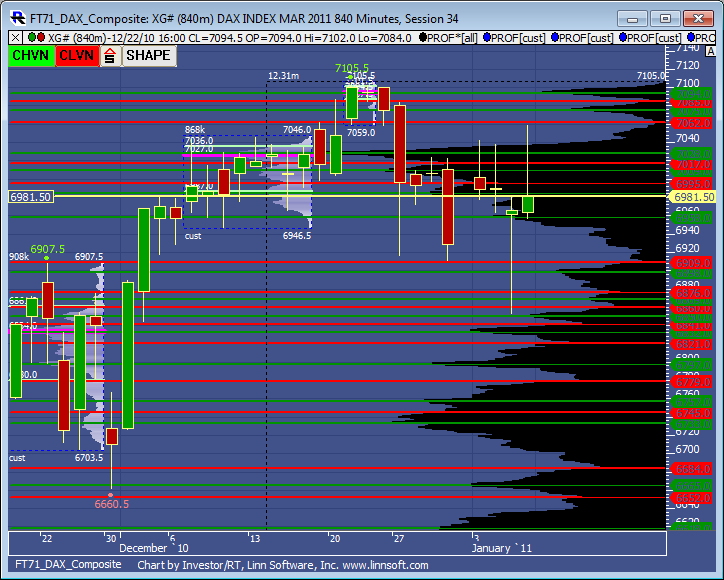
This is a chart of 405-minute bars. The 405-min bars provide daily bars of only the day session data (whereas the normal daily bars include the overnight period). A composite profile is added to the chart using the Profile Indicator setup with a Time Per Profile of All Bars. This forces the profile to include all the data in the viewing period of the chart. This chart is setup with a viewing period of "05/16/08 to present" and may need to be adjusted going forward per FT71.
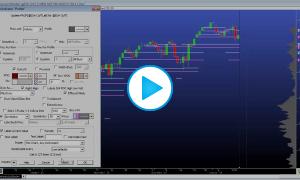
This video details the Profile indicator which provides users with the ability to plot profiles (time/tpo-based or volume-based) on their traditional charts, of varying custom durations. Especially of interest to longer term TPO Profile chartists.
This video demonstrates how to plot the nearest 3 high and low volume nodes historically using the Profile Indicator to review how price reacted to these key levels over time.
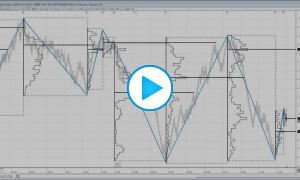
This video demonstrates how to form dynamic volume profiles of market moves identified by the Zig Zag Indicator. In this case, we take moves of $5 or greater on the ES and construct volume at price profiles. Zig Zag based Signals are used to dictate the start and end of each profile, but this dynamic profile concept can be expanded beyond the use of Zig Zags. Any condition that can be represented with a Signal can be used to identify the start and end of Profiles.