Custom Profile Charts
Submitted by linnsoft on Tue, 04/23/2013 - 20:46
This video takes a comprehensive look at the many features and applications of the Profile Indicator to implement time and volume-profiles of any duration.
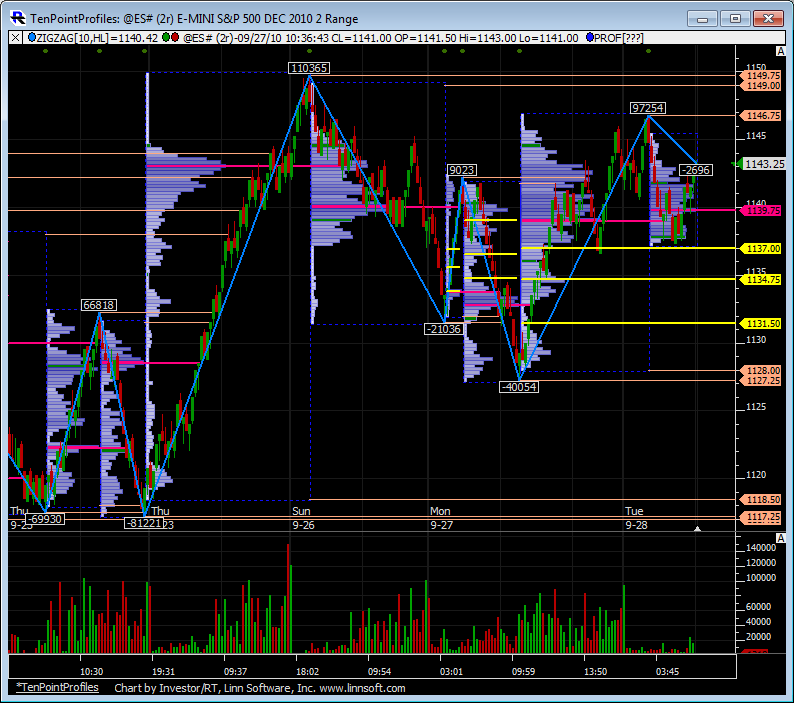
This 2 Rangebar chart of ES includes the Zig Zag Indicator identifying 10 point moves and labeling the delta of each move. The Profile Indicator gives the volume profile of each move and extends the naked VPOC, High, and Low of each profile until it is taken out by a future price. This chart is explained in more detail in the video Ten Point Profile. The video also explains how to create the chart from scratch. This chart requires the Investor/RT TPO Profile Package.
This video demonstrates how to use the Profile Indicator to create merged and split profiles as an alternative to the TPO Profile chart for both volume and time based profiles.
How to better manage and clean-up overlapping profiles and bars in multi-pane charts.
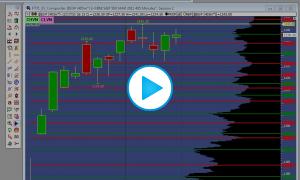
This video demonstrates how to add micro-composite profiles to a chart.
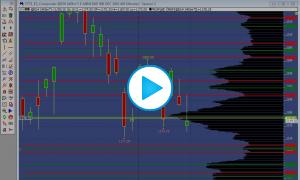
This video addresses why composite Profiles can exhibit different volume nodes based and different forms depending on the amount of tick retention. Smart compression is also covered.