Building RTX with Visual Studio 2013
IMPORTANT
If you plan to use Visual Studio 2013 to build RTX Extensions, you must go to File → Preferences → Configuration and set the Configuration Variable called VisualStudioVersion to 2013.
If you plan to use Visual Studio 2013 to build RTX Extensions, you must go to File → Preferences → Configuration and set the Configuration Variable called VisualStudioVersion to 2013.
Released: April 17, 2015
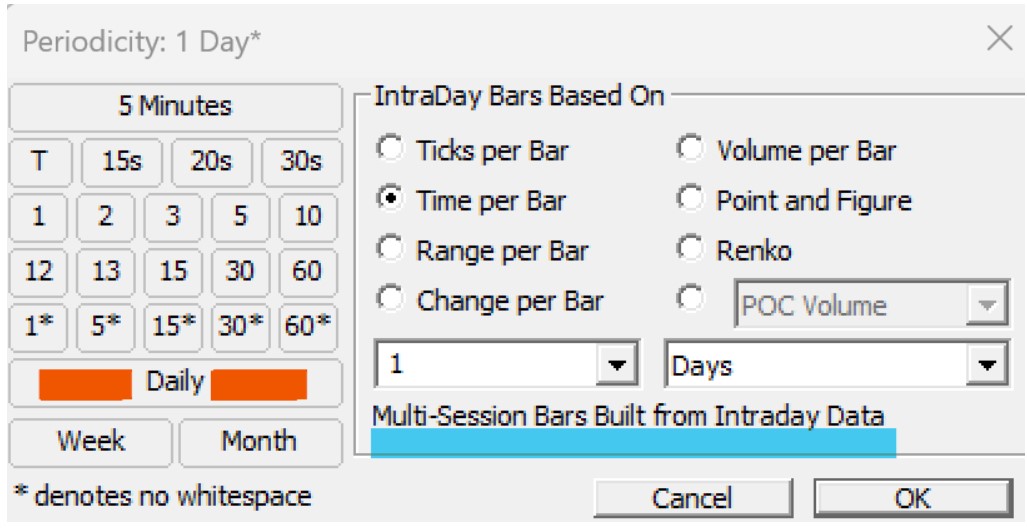
This topic is also discussed in this video : Daily bars honoring day session
This Tutorial will demonstrate how to import symbols into Investor/RT. The topics that will be covered include:
The tails of a Renko candlestick represent the high and low prices achieved in each bar, just like any other periodicity. Traditional Renko chartists are accumusted to plotting Renko bars without the tails. This can be achieved by changing the style of the bars to Wickless Candles (right-click in chart and choose "Style: Wickless Candles"). However, plotting Renko with a style of "Candlestick" and thus showing the wicks or tails can provide some important additional information regarding how high and how low price moved during the formation of that Renko bar.
Charts with certain periodicities require tick data in order to form properly. These include Volume Bars, Tick Bars, Renko, Point and Figure, Range Bars, and Change Bars. These periodicities can also be formed from 1-minute data but generally they will not be as accurate. For periods where there is tick data, Investor/RT will use the tick data to form the accurate bars. Using a proprietary algorithm that simulate a full tick by tick trade distribution from a 1 min bar data, it will then use the information derived from this 1-minute data set before that to form those bars as best possible. By default, Investor/RT will form bars from 1-minute data for up to 50 days back. For per
There are several methods for doing this. Please note that these methods are nowadays very rarely needed for the futures live streams we are getting from IQ feed, Rithmic, CQG or Interactive Brokers. For stock data reception, depending on the exchange, this might still have some interests. In all cases, a single bad tick may still happen on every market and the manual method discussed below always offers an efficient way to eliminate such outliers.
| General Program Keyboard Shortcuts | |
| Keyboard Shortcut | Result |
| Alt + O Key | Opens the Object Manager |
| Alt + P Key | |
| Shift + Alt + P Key | Takes Picture of Front Window |
| Alt + C Key | Create New Chart (Chart Setup Wizard) |
| Alt + R Key | Opens the RTL Editor Window |
| Alt + G Key | Start Data |
| Alt + K Key | Stop Data |
| Alt + N Key | Open Window Manager |
| Alt + 6 Key | Opens a Data Download Window |
| Alt + 4 Key | Opens the Data Status Window |
| Alt + 5 Key | Opens the System Status Window |
| Alt + V Key | Verify Database |
| Alt + B Key | Backup Database |
| Alt + U Key | Opens the Database Wizard |
| Ctrl + E Key | Opens Export Data Window |
| Alt + 7 Key | Opens the Import Data Window |
| Alt + 9 Key | Opens the View/Edit Data Window |
| Alt + 8 Key | Opens the Playback Window |
| Alt + A Key | Opens an Instrument Setup Window |
| Shift + Alt + A Key | Opens Alarms Window |
| Alt + Y Key | Opens a list of Preferences |
| Alt + ] Key | Next Layout |
| Alt + [ Key | Prior Layout |
| Alt + M Key | Open Message Log |
| Alt + L Key | Show/Hide Layout Toolbar |
| Alt + T Key | Show/Hide Active Toolbars |