
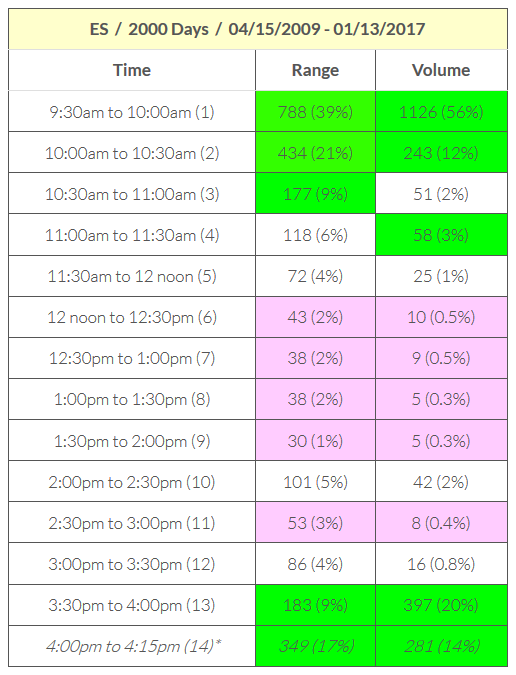
This chart helps to identify the 30 minute period within the day session that had the highest range and volume, and accumulates that information over a 2000 day period. The button at the top dictates which 30 minute period the chart is analyzing (1 for 9:30am to 10:00am ET, 2 for 10:00am to 10:30am ET....13 for 3:30pm to 4:00pm ET, etc). The table below shows how many days (out of 2000) the highest range and highest volume was made with each 30 minute period. For example, on 788 of the 2000 days studied, the first 30 minute period of the day (9:30am to 10:00am ET) had a higher range than any other 30 minute period/bar. And only 5 days out of 2000 (0.3% of days) did the 1:00pm to 1:30pm ET 30-minute period expeirence volume greater than all the other 30 minute bars during same day. The top 5 and bottom 5 in each category are highlighted in green and pink respectively. This study was performed on the ES on a 2000 day period (04/15/2009 to 01/13/2017).
| ES / 2000 Days / 04/15/2009 - 01/13/2017 | ||
|---|---|---|
| Time | Range | Volume |
| 9:30am to 10:00am (1) | 788 (39%) | 1126 (56%) |
| 10:00am to 10:30am (2) | 434 (21%) | 243 (12%) |
| 10:30am to 11:00am (3) | 177 (9%) | 51 (2%) |
| 11:00am to 11:30am (4) | 118 (6%) | 58 (3%) |
| 11:30am to 12 noon (5) | 72 (4%) | 25 (1%) |
| 12 noon to 12:30pm (6) | 43 (2%) | 10 (0.5%) |
| 12:30pm to 1:00pm (7) | 38 (2%) | 9 (0.5%) |
| 1:00pm to 1:30pm (8) | 38 (2%) | 5 (0.3%) |
| 1:30pm to 2:00pm (9) | 30 (1%) | 5 (0.3%) |
| 2:00pm to 2:30pm (10) | 101 (5%) | 42 (2%) |
| 2:30pm to 3:00pm (11) | 53 (3%) | 8 (0.4%) |
| 3:00pm to 3:30pm (12) | 86 (4%) | 16 (0.8%) |
| 3:30pm to 4:00pm (13) | 183 (9%) | 397 (20%) |
| 4:00pm to 4:15pm (14)* | 349 (17%) | 281 (14%) |
* Since the last period, 4:00pm to 4:15pm (14) is only 15 minutes, the range and volume were doubled before comparing to the max range or volume of the session. This approach is more valid in the case of volume than range.
The charts below plots the average range and volume by 30 min period, for both the Bund and the ES. This chart was used to produce the screenshots below.
hi
is the chart in the "30 Minute Period with Highest Range and Volume"
"This chart helps to identify the 30 minute period within the day session that had the highest ..". is the right chart ?
thanks Uri
Yes, this chart is the correct chart used in the post above to produce the table.
hi
i find only the average range chart by 30 min period did not find the Volume chart .
thanks
Uri
The charts below analyze volume and range in each 15 minute period of the sesssion. In the top chart, second pane, the pink bars show the volume of each 15-minute period while the blue dots show the max volume per bar of all bars of session. In the top pane we mark the bar that had the highest volume in the session. In the 3rd pane we sum up the number of times each 15 minute period had the highest volume of all bars in the session. In the bottom pane, the same values is presented as a percentage of all days analyzed. The second chart does the exact same analysis on range instead of volume. These charts are designed for 15 minute analysis and the periodicity cannot be changed without other adjustements to the custom indicators and signals used in the chart. However, the chart will work fine with any symbol and any session. The computations in these charts are relatively heavy and will require a few seconds to open the chart.
Reading the top chart, 789 times, on ES, the first bar of day session had more volume than any other bar in the session. And that constituted 39.9% of all days analyzed. The first bar of session lead the way in both volume and range, although the next to last bar (3:45 to 4:00pm ET) was a close second in volume.
Chart Definition (Volume): https://www.linnsoft.com/charts/hw-timeperiodmaxvolume-es
Chart Definition (Range): https://www.linnsoft.com/charts/hw-timeperiodmaxrange-es