
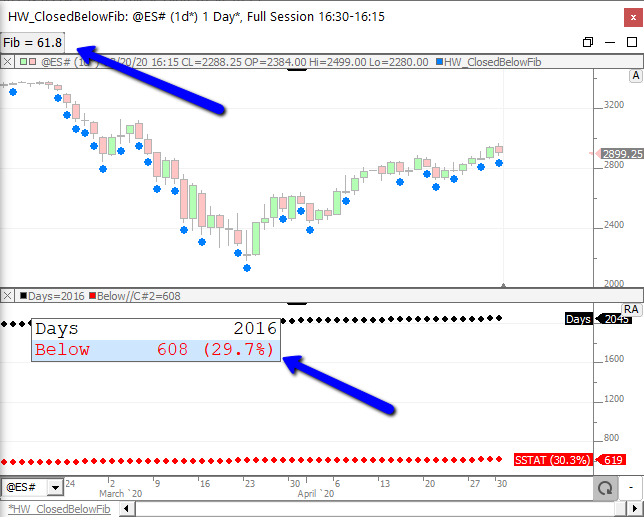
The chart below counts the number of times price closed below a fib level and presents along with the percentage of all days. In this case, of the past 2016 days, the price closed below the 61.8% retracement level 608 times or 29.7% of the past 2016 days. The Fib level is computed from high to low of the same day (61.8% levels would be closer to the low than high). This translates to closing in the bottom 38.2% of the range 29.7% of the time. Use the bottom at the top of the chart to dynamically adjust the Fib Level to any number > 0 and <= 100.
Chart Definition: https://www.linnsoft.com/charts/hw-closedbelowfib-es
This chart takes it a step further by providing min and max fib levels. It also shows the count that closed below the max level as well as the count that closed above the min level. Since the retracement is being computed from high towards low, the Max levels price will actually be the lower price, but should always be a greater number than the Min level.
Chart Definition: https://www.linnsoft.com/charts/hw-closedbetweenfibs-es