
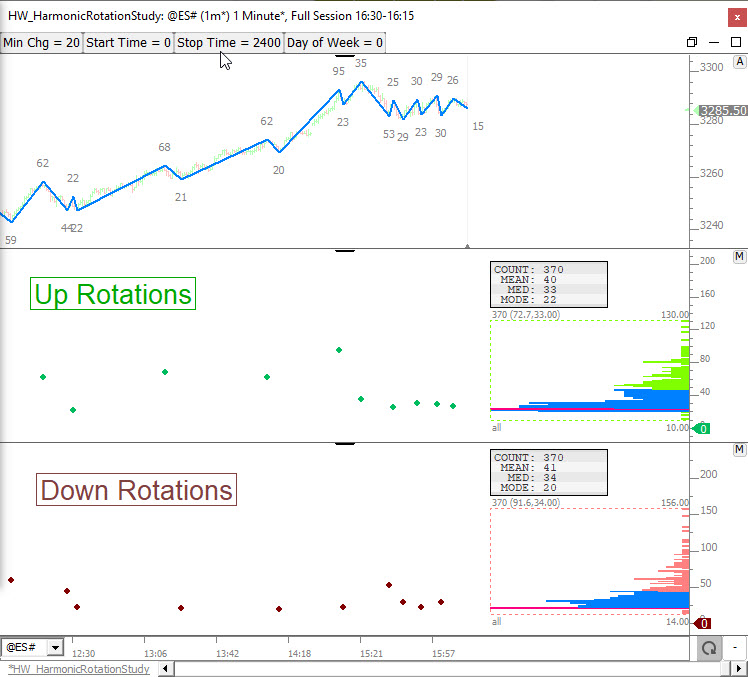
This chart identifies market moves, plots the size of the up moves (or rotations) and the size of the down moves, and providies various statistics on these up and down moves (mean, median, and mode). Filters are available for both day of week and time of day.
Use the link below to import the chart defininition...
https://www.linnsoft.com/charts/hw-harmonicrotationstudy-es
The buttons in the chart above control the following...
- Min Chg - The minimum changed (in ticks) used by the Zig Zag and Zig Zag Oscillator indicators that build this study. With a setting of 20, moves of 20 ticks or larger will be identified and used to compute the median, mode, and mean.
- Time Filter: Start Time and Stop Time - A time filter is available to restrict the moves considered to only those between the Start Time and the Stop Time. If no time filter is desired, simply set the start time to 0 and the stop time to 2400. To filter to only day session for example (if in eastern time zone) set the start time to 930 and stop time to 1615. To restrict to only overnight moves, set start time to 1630 and stop time to 930.
- Day of Week Filter - To filter by day of week, set the Day of Week to values between 1 and 5. A value of 1 will limit to only the 1st session of week (Monday if day session or Sun/Mon session if chart set to full session). 2 for 2nd session, 3 for 3rd session, 4 for 4th session, and 5 for 5th (Friday) session. If no day of week filter is desired, simply set Day of Week button to 0.
Some other notes regarding the chart above...
- Indicators Involved - The custom indicators in the lower pane use the Zig Zag Oscillator (ZZO) to extract the size of the up and down rotations. The Profile Indicators on the right then accumulate these values from the custom indicator and plot histogram and provide the statistics of mean, median, and mode.
- Periodiicity - This chart is set to a periodicity of 1-minute. You may choose to change the periodicty to a price-move-based periodicity like 2t Renko for more accuracy, but keep in mind you will need tick data on file for your full view period in order for 2t Renko to be fully accurate. In my study of min change sizes of 20 or greater, the 1-minute bar results were very similar to those of Renko and with 1-minute data you will be able to analyze data much further back.
- View Period - The statistics will reflect the view period of the chart and will consider all moves within the view period. The chart above is set to "Last 10 Days" so the statistics presented by the Profile Indicator reflect the moves of the last 10 days (or sessions). To change the view period, just click on the chart then click the period key on keyboard (or right-clcik in the chart and choose Setup > View Period).
- Session - The statistics will also reflect the session of the chart. The chart above is set to full session so the statistic will reflect all moves in both the day and overnight session. If you'd prefer to only consider moves in the day session, simply change the session of the chart by hitting the comma key (or right-click in chart and Setup > Charting Hours).
- Statistics - MEAN is the average size of all the up moves (or down moves). MED is short for median and if all the moves were sorted, the median is the value right in the middle of the sorted values. Example 24,25,28,32,45. Median is 28. The MODE is the move that was identified most often. In the chart above, 20 is the mode which mean the minimum move/change allowed turned out to be the most common.
If you have any additional requests or suggestions for this homework study, or if you have any questions about the chart, then indicators, or the results, please respont to this topic. We welcome any ideas you might have to enhance this chart including additional filters. We also welcome you to share how you might use this information in your trading.