G'day Chad! Post FT71s webinar on Futures.io around Changing markets and what homework to do when doing so, I have been beating my head against a wall trying to recreate some of those statistics. The ones I am having trouble with are
- How often only 1 IB (high or low) is broken during RTH ?
- How often we close above the IBH / how often we close below the IBL ?
- How often we close above the IBH if we only break the IBH / how often we close below the IBL if we only break the IBL ?
- How often we close above the mid if we only break the IBH / how often we close below the mid if we only break the IBL ?
Help? Please?
Below is the chart definition. The statistics are as follows...
IBH = Initial Balance High = High of first 60 minutes of day session.
IBL = Initial Balance Low = Low of first 60 minutes of day session.
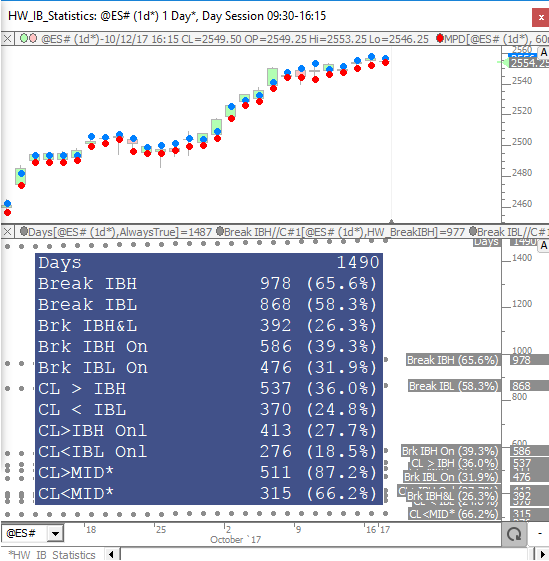
The statistics in the chart below were created using 1441 days ending 10/16/2017. Day session only data on ES.
The results are expressed in percentages. For example, the Break IBH 65.6 tells us that 65.6% of the 1441 days the broke above the IBH at some point during the session.
(The reason some of the lablels are so abbreviated is due to a limitation on the number of characters in the labels).
https://www.linnsoft.com/charts/hw-ib-statistics-es
Can you clarify one thing for me. For the more restrictive data points are they a percentage of the whole or of the specific case?
For example
CL > MID (>IBH)
Is this
1. 35.4% of all days the close will be above the mid and the IBH will be broken
OR
2. 35.4% of the occurrences of an IBH break (65.6% of total days) the close will be above the mid coming to a 23.22% chance of closing above the mid and the IBH breaking across all days
CL > MID (> IBH)
This provides the percentage of days the close closed above the midpoing, AND the IBH was the only side of the IB to be breached. It is a percentage of all days. Although could be done either way if needed.
Thanks Chad! This is really awesome of you to do.
Could you give me a point in the direction of how I would change this to use the smaller data set for those percentages? Not asking you to do all the work but an example of one would be great.
Sure. As a specific example, let's assume you want to know....of the days where only the IBL is breached, how many of those days do we close below the mid. What you need to do to make this happens, a few steps. First, you would add an indicator to the chart (Signal Statistics) that counts the bars in the chart and stores that into a C# (C#1 in our case). Then, you change the Signal Statistics indicator used for IBH Only to compute "Sum of All Signals" (instead of percent) and also store that into a C# (C#3 inour case). You also have to change the label for IBH Only, to append //C#3 as you see below. When you do that, it uses C#3 as the divisor when computing the percentage, so it results in showing not only the percentage, but also the total number. (See below).
I repeated this process for all the stats so that now you see not only the percentage, but the total count for each one.
I'm using C#1 as the divisor for all of them but the last 2. I stored the total number of IBL Only into C#3, and used that as the divisor for CL<MID*, and I stored total count for IBH Only into C#2 and used that as divisor for CL > MID*. I hope that is clear.
Awesome, thanks so much! This is great.
Thanks so much for doing this Chad.
Chad I apologize, this will probably be the dumbest question you will hear all day. Using your stats as an example, we break the IBL ONLY 18.7% of the total dataset. Yet we close below the mid when only the IBL has been broken 22.3% of total dataset?? How can we close below the mid when only IB Low has been broken on MORE days than we actually broke just the IBL?? Or am I reading this totally wrong?
Darren,
Not a dumb question at all. You are absolutely right. There was an error in that calcultion. I have corrected and replaced the chart / definition in the original post. Just import the chart again and replace all. Thanks for pointing this out. I also added additional information...showing both the count of each stat as well as the percentage. I'm also now computing the CL > MID and CL < MID as percentages of the IBH and IBL Only days respectively. Let me know if you find any other inconsistencies.
This is great , thanks.
In addition to Ben's question, I'm confused by IBH break 65.8% , IBH & IBL break 26.5 therefore IBH only should be 39.3% and you get 39.1% (close enough for government work).
However using the same logic for the IBL doesn't work so well. 58.4%, 26.5% should net 21.9% as IBL only but it says 18.7% - that seems to be too big difference to blame on rounding.
Pages