
Chart identifies which bar or bracket FIRST breaks the Initial Balance. 2nd pane identifies which bar first breaks the IBH (3 represents 3rd 30-min bar or 3rd bracked or C Bracket - Also 1st bar following the completion of IB). 3rd pane identifiees which bar/bracket first breaks the IBL (Initial Balance Low = low of 1st 60 minutes of day session). And the 4th pane identifies which bar/bracket first broke out of the IB (either direction).
So in the second pane where we see "3 (616) 50.5%". The 3 repesents the IBH being first broken during the 3rd 30-min bar or 3rd bracket...which is also the 1st 30-min bar following the initial balance (1st 60 mins of day session). So on 616 of the days studied, which is 50.5% of the day studied, the initial balance high was first broken during the first 30-min bar that followed the IB.
In the 4th pane we see "3 (1108) 63.0%" which tells us that 63% of the time we first break out of the IB (either direction) during the first 30 minutes following the IB.
Chart Definition: IB Break Bar (@ES)
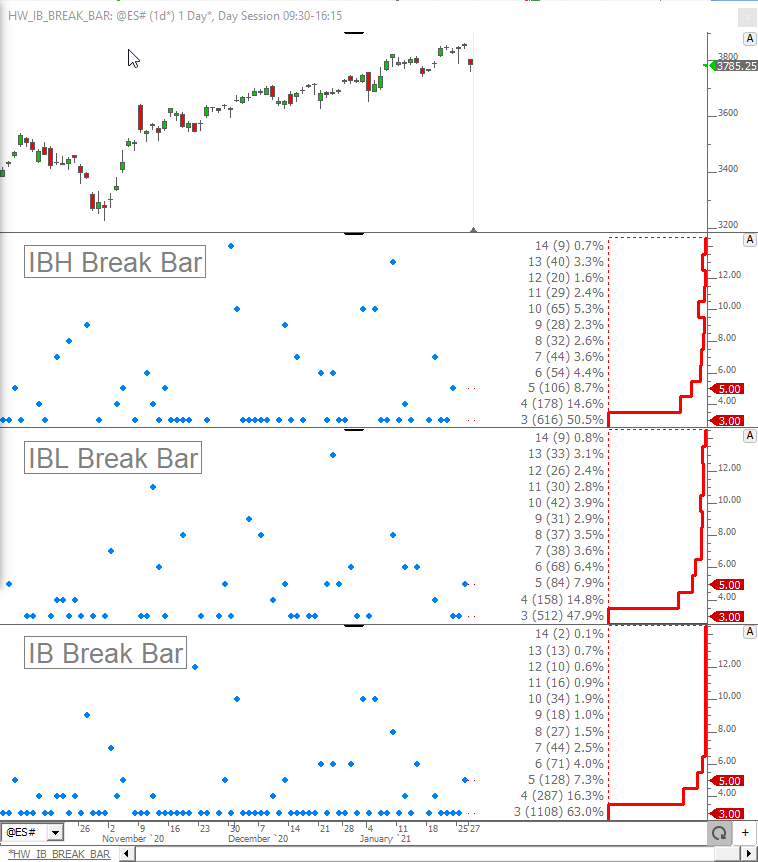
Chart plots the max moves that occur beyond IBH and IBL when price breaks the IBH and IBL during each bracket. Use button at top to adjust bracket (3 for C, 4 for D, etc).
In the chart below the the button at the top is set to 3 which represents the C bracket or 1st 30 minute session beyond the IB. The blue dots plot only on the days where IBH was broken during the C period and the value reflects how far price moved beyond the IBH (in ticks) for the rest of the session. The profile indicator on the right accumulates this info and computes an average/mean of 37 ticks with a median of 25 ticks and a mode (most often) of 4 ticks. The median of 25 ticks is probably the most reliable stat in this situation as far as expectation.
Chart Defininition: https://www.linnsoft.com/charts/hw-ib-break-stats-esh1
Using the button to change to 4 (D brackets) provides the followig stats for days where price moves above IBH during D bracket.
E Bracket...
F Bracket...
G Bracket... (note sample size is shrinking)
H Bracket...
I Bracket...
J Bracket...
K Bracket...
L Bracket..
Might as well do them all. M Bracket... Notice the count of this 15 minute M bracket is higher previous couple of 30-min brackets.
The chart below computes how often the price first breaks above the IBH (and below IBL) during each bracket...and in those situations, counts how many times price remained above that IBH (or below the IBL) for rest of the session.
The chart below is looking at bracket D as reflected by the 4 in the button indicator at top. Use that button to change the chart to study any bracket. In this situation, we are studying 1810 days (ending 1/27/21) and of those 1810 days, 182 times price 1st broke the IBH during the D bracket (10.1%) and of those 182 days, the price stayed above the IBH for the remained of the brackets/day 24 times which is 13.2% of the days.
Chart Definition: https://www.linnsoft.com/charts/hw-ib-break-and-stay-esh1
Bracket D...
Same study on bracket C...
Bracket E...
is there a way to see the same thing for Overnight levels. Such as how often will we break either ON level within each 30 minute period similiar to this one? I would like to see what % is greatest for the on level to break in
Did you check out Homework #27 on the Homework page: https://www.linnsoft.com/videos/homework-27-studying-time-session-price-breached-dayovernight-highlow
Does that give you what you need?
This chart performs the same analysis, but using the Overnight High (ONH) and Overnight Low (ONL): https://www.linnsoft.com/charts/hw-break-bar-es