
In this homework study, we are going to break each day into one of four categories based on the opening type.
- Higher Outside Range (HOR) - Open is above the previous days high/range.
- Higher Inside Range (HIR) - Open is between the previous day close and high.
- Lower Insider Range (LIR) - Open is between the previous day low and close.
- Lower Outside Range (LOR) - Open is below the previous day low/range.
And for each day type, we will calculate how frequently we touched the previous day VAH, POC, and VAL.
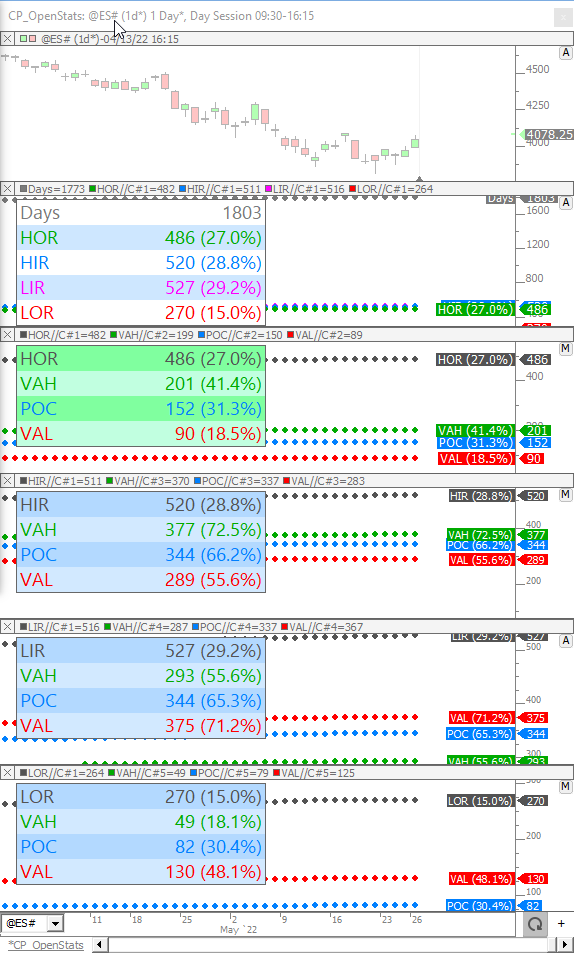
In the chart below, we study 1803 days, and of those 1803 days, we opened above the prev high (HOR) 486 times or 27% of the time. And of those 486 days where we opened HOR, 152 times, or 31.3%, we moved back to touch the prev day POC.
This Video on Opening Statistics explains in detail how each of these statistics are computed.
Chart Definition: https://www.linnsoft.com/charts/cp-openstats-es
This is awesome.
When upload it to my investor/rt platform it only shows me 119 days. Am I missing a data plugin?
Im gonna try to see if I can play around on it on my end and try to find the % of CLOSING below those 3 terms we have started with (VAH, POC, VAL):
Im sure I'll have questions but thanks for this so far.
You'll need to go to File > Preferences > Data > Historical Data...
On that screen, you can choose your symbol of interest (@ES# or whatever symbol you're working with) and expand the 1-min retention to maybe 4000 days or however far back you want to go. Then, go back to chart, right-click on chart and "Download Data > All Data" and give it a minute to complete that download. Then the number of days should expand. You can always change the view period to change how many days you're considering.
its CLOSES ABOVE not below in these stats for the chart I shared in the application.
Here is a snip of it.
I'm not clear what you're asking here if anything. Can you expand on what you want?
yes, i am looking for the statistics for 2 scenarios here:
1. The statistics for price GOING to VAH,VAL,POC
2. The statistics for price CLOSING ABOVE VAH,VAL,POC
In my study chart that i included, I showed the statistics for price closing above the VAH,VAL,POC in each of the 4 scenarios.
HOR
HIR
LIR
LOR
Now How would I expand this to include the other value areas like the Initial Balance High and Initial Balance Low.
I would like to the know % of price breaking the CURRENT days IBH or IBL.
I would also like to know the % of price breaking the PREVIOUS days IBH or IBL as well. That could be interesting.
I basicially want to expand from those 3 value areas to the others I snipped above. I would love to know how to expand it and make it exactly like the july 2018 doc but recent data.
Is there a way to auto populate the charts with the values I am looking for?
The values are regular like the IBH and IBL and Overnight HIghs and Overnight Lows (you are probably already familiar with those terms),
I looked over the session statistics video and see how you calculated for the IBH and IBL manually but I am not understanding why the chart cant auto populate those values. How would I now use this value as a token to get the statistic for % price breaking previous and current days IBH/IBL as well as closing like we did for the VAH,VAL,POC.
Seems like I will be needing to add alot of tokens manually?
I am trying to avoid RTL because of unfamiliarity and feel like session statistics indicator would be better alternative.
This homework study is for HOR stats for PIBH,PIBL. Feel free to look over if an error was made in coding.
So you would just follow the instructions in my video for creating the signals for PIBH.....or even for closing above VAH or between VAH and POC.
So here is the syntax we've already used for opening Higher Outside Range (HOR) and touching the VAH...
OP > HI.1 AND HI >= PROF_VAH.1 AND LO <= PROF_VAH.1
so to look for it to touch pIBH instead of VAH, you'd just change PROF_VAH to a token that gives you IBH. And I would recommend MPD for this....with settings below...
and your syntax would be...
OP > HI.1 AND HI >= MPD_IBH.1 AND LO <= MPD_IBH.1
and you'd save that Signal with a name lke "CP_Open_HOR_PIBH" and use it within Signal Statistics as described in video.
For opening HOR but closing between VAH and POC...
OP > HI.1 AND CL <= PROF_VAH.1 AND CL>= PROF_POC.1
Hope that helps...
Thank you for this Chad,
My fear with this is that since I am not good at this type of program, that my final statistics will be off. Which is what it looks like for the ONL and ONH stats...
OK. Hopefully my guidance in last response will help.
But as far as ONH, this is how I'd access ONH with MPD.....
If you continue to get questionable results, please feel free to share the chart definition here and I'll take a look.
Pages