
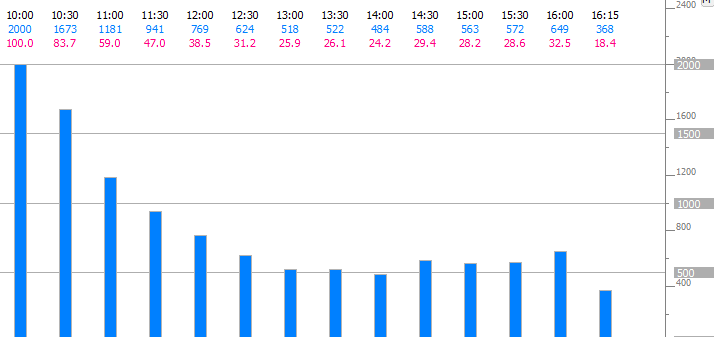
How often is the range extended in each 30 minute period (or "bracket")? This chart provides the answer. The snapshot and table below reflect 2000 days on the ES ending 01/19/2017. Results are reflective of day session only. Each 30-minute bar is labeled with the ending time of bar (in black), number of times range expansion occurred during that bracket (in blue) and the percent of the 2000 days range expansion occurred during that bracket (in pink). During the 1st bracket of the session (9:30am to 10:00am ET), range expansion logically occurred 100% of the time as this bracket established the day session range. Range was expanded/extended further in the following bracket (10:00am to 10:30am) 83.7% of the time (1673).
| ES / 2000 Days / 04/15/2009 - 01/13/2017 | |
|---|---|
| Time | Count |
| 9:30am to 10:00am (1) | 2000 (100%) |
| 10:00am to 10:30am (2) | 1673 (84%) |
| 10:30am to 11:00am (3) | 1181 (59%) |
| 11:00am to 11:30am (4) | 941 (47%) |
| 11:30am to 12 noon (5) | 769 (38%) |
| 12 noon to 12:30pm (6) | 624 (38%) |
| 12:30pm to 1:00pm (7) | 518 (26%) |
| 1:00pm to 1:30pm (8) | 522 (26%) |
| 1:30pm to 2:00pm (9) | 484 (24%) |
| 2:00pm to 2:30pm (10) | 588 (29%) |
| 2:30pm to 3:00pm (11) | 563 (28%) |
| 3:00pm to 3:30pm (12) | 572 (29%) |
| 3:30pm to 4:00pm (13) | 649 (32%) |
| 4:00pm to 4:15pm (14)* | 368 (18%) |

Is there any way to find 5, 10 , 20 day average ranges of price?
Additionally, where can relative volume be found?
Lastly, are there any other ways to look for potential range expansion, and probabilities on that data?
Thank you!
When you say "10 day average of prices"....do you just mean the average range of past 10 days?
If so, this chart shows actual range (red dot) vs 10 day avg range (blue histogram).
https://www.linnsoft.com/charts/hw-avgrangevsactual-es
Yes, I did mean the average range of the past 10 days. Thank you.
Now when you say "actual range" does that refer to the session's range, range of current timeframe, chart displayed, or am I missing something?
Range of day it's lined up below.
How could I add the current relative volume of the past 10 days. Viewing it separately would be fine as well.
Thanks
Is this what you're looking for? It's taking current volume relative to average of last 10 days... (bottom pane)
https://www.linnsoft.com/charts/hw-avgrangevsactual-es
That may be it, although I'm only getting about 8 days of data and the sesst indicator shows nothing
Go to Preferences > Data > Historical Data and check the retention settings for the symbol in question. Expand the 1-min retention to something like 1000 or 2000 days. Then right-click on chart and "download data > full data".
Sorry, but I'm still unable to open that chart with data. Not sure how to attach a print screen file. I followed your instructions for data retention.
So you are unable to open the chart? Or you can open the chart fine but you still only have 8 days of data?
Pages