Hello,
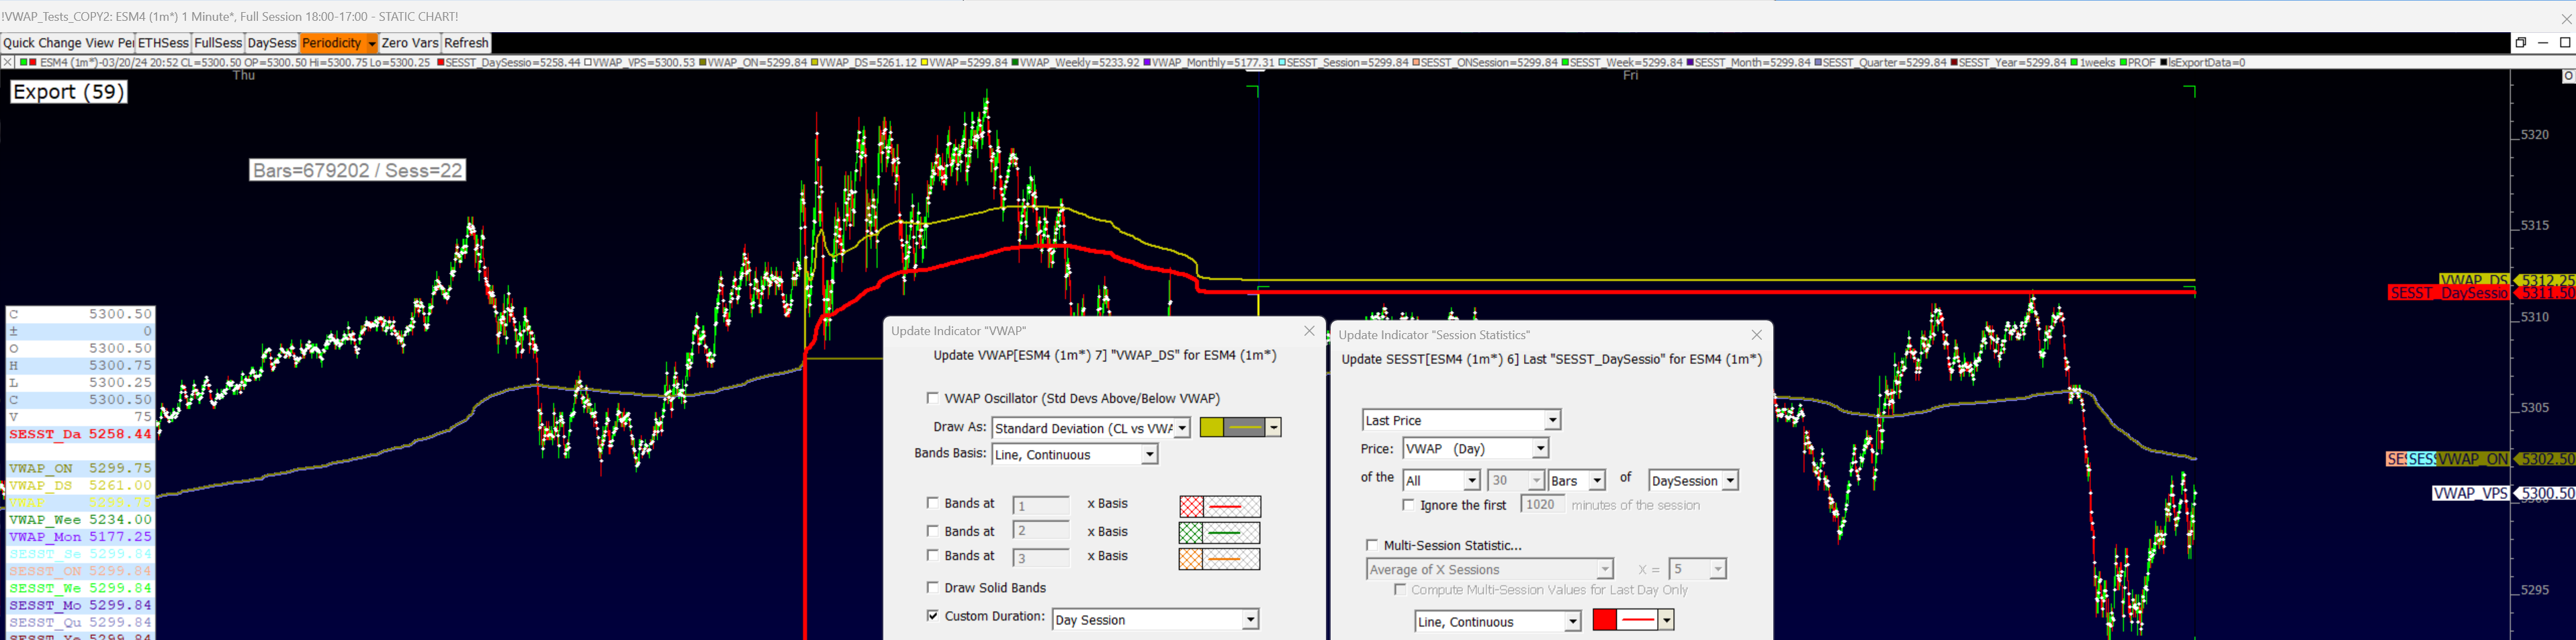
I created a bunch of presets recently and noticed that VWAP can give different results depending upon how you try to retrieve its value. So i setup a new chart and put all the different variations of VWAP that can be made using VWAP by itself, all the SESST variations and finally all the MPD variations i was interested in checking. I noticed that the SESST versions gave results that didnt match up with what was expected, For instance, a plain old VWAP with no settings on a 1 minute Day Session chart gives you the DaySession value. If its on a FullSession chart you get the FullSession value. If you use a VWAP set to DaySession on either a DS or FS chart you will get the DaySession value on both. But a SESST set to Last Price VWAP(Day) of All Bars of DaySession doesnt give the correct value on a FS chart. Ive attached a pic of a chart with the value in question as a reference(I used a static chart for these tests.) The red line that is plotting 5311.50 is the one that is not a vaild value.
What does the result im seeing actual represent?
Is DaySession not meant to be used in a SESST the same way it is in a MPD? I figured since the FullSession chart contained the DaySesssion data that the SESST VWAP would plot the correct value but i was obviously wrong.
One last thing, a bit off topic but still pertaining to SESST... Ive been wondering what the different price choices for VWAP and VPOC are in the price dropdown list? Ive been using Day but am curious as to what 'Bar' and 'All' return. I looked at help content and asked here at one point but still havent found an answer.
Thanks,
Dean
Hi Dean,
there are several mixed questions in your post.
Let's start with some basic about SESST
The 3 first important pieces of information for the SESST token are (as this is the case for almost all IRT indicators)
a) on which chart periodicity it will be applied
b) on which chart session it will be applied
c) the lookback period of the chart
as the SESST indicator will (one way or the other) only be able to access/manipulate the corresponding bar data present on that chart (and the characteristics of all individual bar data are defined by these 3 parameters)
Only the MPD indicator can access/manipulate bar data not having the periodicity of the chart (he is applied to) or not referring to the same session...
So SESST can only process bar data available on the chart (and not any bar data from other sessions or referring to other periodicities). Therefore, when you are using inside a SESST definition a reference to a "session", this session must necessarily be a sub-session (resp. sub-period) of the current chart session (resp. chart full lookback period)
Now let’s discuss IRT price sources
Almost all IRT indicators (incl SESST) have access to a variety of price sources.
Indeed, for each given bar of a chart, an indicator is processing a historical array of data, with CLOSE, LO, HI, Volume, HI-Lo range.. being the most common ones. However, IRT provides also access to many other possible volume or tick derived “price sources” to perform more specific analysis.
VWAP(Bar), VWAP(Day) and VWAP(All) are part of these non conventional prices sources
Obviously, VWAP(Bar) returns the weighted average prices of all transactions of a given bar, VWAP(Day) returns the VWAP since the first bar of the chart viewing session, and VWAP(All) will return the VWAP value starting from the first bar of the chart.
For example, one might easily consider that the VWAP of the current Bar is a more relevant/representative price of that bar than just the CL (or the Midpoint), as that VWAP is calculated based on all individual ticks information.
Anyhow, back in Version 11, a dozen of new volume-related price sources were introduced, including VPOC (Bar), VPOC(Day), VPOC(All), VWAP (Bar), VWAP (Day), VWAP (All), Delta, Cum Delta (Day), Cum Delta (All), Buy Volume, Sell Volume, Ticks/Trades, Max Price Volume, and Average Size.
These new options enable powerful new possibilities for technical analysis: A Moving Average of Cumulative Delta, the Highest High of Session of VWAP, and many more. Previously, such analysis could not always be done, and solely by creating custom indicators in RTL. The new price types are not only easier to setup but they calculate more efficiently as well.
On a final note, not all combination of the SESST indicator makes sense, as some are only pertinent to specific price sources, chart periodicity & lookback period or indicators.
Sometimes, MPD is the only way to go. Sometimes SESST, sometimes a combination of both is needed. There is no global rule
Mixing some randomly selected presets or picking up a specific SESST indicator (without knowing why it was developed or on which type of chart it was applied) makes rarely sense. I am taking the opportunity to answer at the same time to your question posted here
https://www.linnsoft.com/topic/custom-indicator-correct
I can’t comment on any SESST setup question without knowing the associated a) b) and c) information, and starting a reverse engineering guessing game is not the right approach.
To help (with any SESST or MPD settings), we first need to know, in "plain English", what you are exactly trying to achieve : For example, on a 1 min short term trading chart (having a look back period of x days), and displaying a eth/rth session, I would like to display the current value of the Weekly full session / day session) VWAP, or the final value of the previous week VWAP, etc
The way such displays may be achieved might be completely different if this would be a 60 min chart vs a 1 min chart or a renko chart for example.
And, depending on your objective, when dealing with Higher Time Frame information (such as weekly or monthly VWAP), most of the time, SESST is not necessarily the most efficient way to go (a plain MPD might do a better job or may be just a daily chart with V# variable storing VWAP information).
I hope you will find the above information helpful
Best Regards,
Eddy
Eddy,
Thank you for the detailed explanation! I understood alot of your explanation already but wasnt 100% sure about a few things you cleared up completely now for me. I also wasnt sure if SESST was supposed to plot nothing at all when used incorrectly or just plot some random number. I eventually realized that some of the instances of SESST that i was testing were just returning the closing prices of the previous sessions last bar and they just happened to be close in price to the current VWAP prices i was trying to obtain. Another issue which i did to myself, was that I just blindly searched through the charts on the site when i started with IRT to get what I needed. At the time i was so busy with 2 other projects and i just wanted to get some charts setup to be able export data into excel and be done with it. Now that ive finally got around to setting up my charts for my new layouts i used alot of the indicators from the charts i downloaded and created a can of worms in the process.
There was one other thing i noticed. It also appears that using SESST causes an indicator not plot as much history back as a VWAP derived by some other means(ie- VWAPI or PROF Developing VWAP.) Does that result in better efficiency? Or does it not really matter?
Thanks again,
Dean