Investor/RT supports a wide variety of Technical Indicators. A technical indicator, when added to a chart object, performs some calculation on the historical data of a user-specified instrument within the chart.

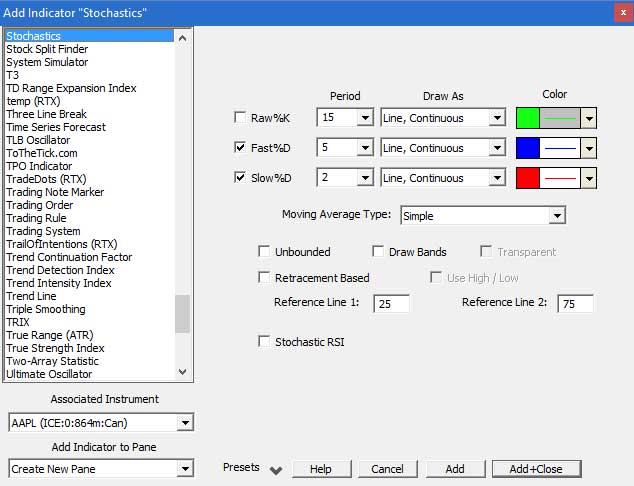
To add a technical indicator to a chart, first click on the "Add Technical Indicator" button  in the Charting Toolbar. Next, select the technical indicator you would like to add to your chart from the list of indicators in the list. Each indicator has it's individual preferences, such as "Moving Average Type". The default preferences will already be filled in, but you may change these to anything you wish. If you would like to adjust your default preferences, go to "Setup Prefs:Charting:Techical Indicators". You should also select the "Associated Instrument", or the instrument in the chart that you would like to associate this indicator with, if there are more than one instruments in the chart. Finally, select which window pane in the chart you would like the indicator to go. You can place it in one of the panes already in the window, or you may create a new pane for the indicator.
Once you have added your indicator to the chart, you can edit the preferences at any time by either double clicking on the indicator, or by clicking on the "Edit Chart Element" button  in the charting toolbar.

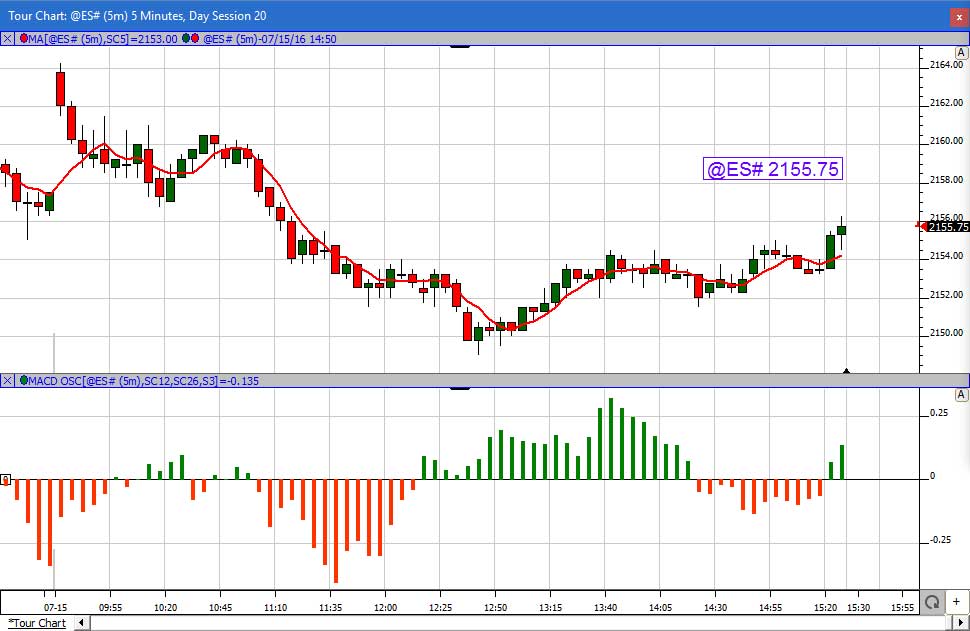
Above is a 5-minute chart of the ES, with two Technical Indicators added. The first, a Simple Moving Average, is overlaying the candlestick chart pane. The second, a MACD, is shown in a separate pane. You can add any indicator as many times as you like to a chart, either overlaying, or in a separate pane, and you may add as many indicators to a chart as you wish.
Technical Indicators are also available as elements in RTL (The Investor/RT Real Time Language). This way, they can be used as components when creating expressions for Scans, Custom Indicators, or Backtesting Signals.
See Also
- Technical Indicator Video This video provides instruction on adding, positioning, and manipulating technical indicators in traditional charts.
- Adjusting Technical Indicators
- Custom Indicators If you don't see your indicator in the list, it is likely you can create it yourself.
- Technical Indicator Scope

