See Also: RTL Language, Scans, BackTesting See Also: Tutorial: Painting Lines and Histograms
A Custom Indicator is an arithmetic expression, built using RTL, the Investor/RT Real Time Language, that can be graphed in an Investor/RT chart. The RTL Language used to specify custom indicators is essential the same language used to specify Scans and Trading Signals, with a few powerful extensions. RTL has been extended in Investor/RT 4.0 to enable any built-in technical indicator to operate on any arithmetic expression, including other technical indicators. A quick example will illustrate the power of the major extension of Investor/RT:
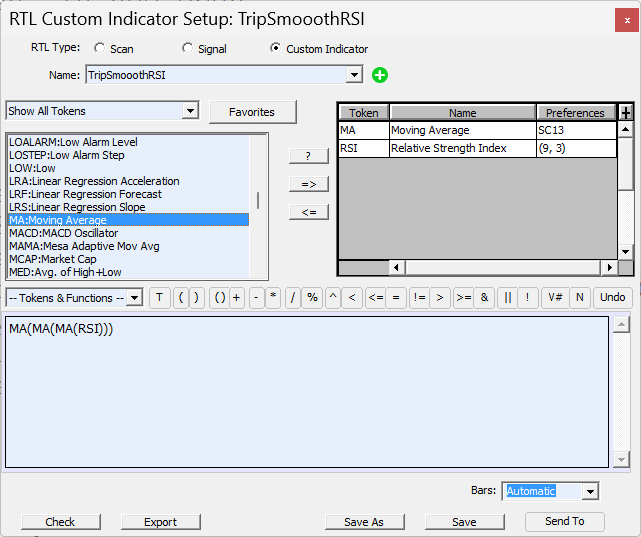
Suppose you want to use a triple smoothed RSI indicator in your analysis. Investor/RT has a built-in RSI indicator, but the built-in RSI has only one smoothing option, not three. This calls for a Custom Indicator. Choose "Custom Indicator" from the Setup Menu. The Custom Indicator Setup window is similar to the Scan Setup window. It has the same list of primitives on the left and an entry box for writing the RTL expression (formula) for the Custom Indicator. Type in:
MA(MA(MA(RSI)))
and click the "Check" button to check the RTL expression for correctness. Investor/RT will prompt you for the RSI and MA parameters and add the MA and RSI tokens to the list on the right automatically. This is a new convenience feature in 4.0 for writing both scans and custom indicators. It not necessary to first list all the elements you wish to use in a scan or custom indicator. Simply write the formula using the tokens as listed in the left side list and Investor/RT will add them to the list of indicators on the right automatically. Now click "Save" and give the custom indicator a name, say "TRIPLE_MA_RSI". Finally, click "Chart" to add the TRIPLE_MA_RSI custom indicator to the current chart window. Custom indicators, like built-in technical indicators are saved with the chart when you save it. In order to calculate and graph the TRIPLE_MA_RSI indicator, the RTL expression MA(MA(MA(RSI))) is evaluated by Investor/RT as follows:
- Calculate the RSI using the instrument data under study in the chart window.
- Perform the MA function on the resulting RSI line
- Perform the MA function again on the smoothed RSI line produced by step
- Perform the MA function again on the resulting double-smoothed line to produce the triple smoothed RSI line
- Draw the triple smoothed line produced in step 4
Notice that the smoothing is performed three times in succession using the same moving average specifications, i.e. if the token MA is setup as a simple-9-period moving average, then the RSI will be smoothed three times using a simple-9-period average. If different smoothing specifications are desired for each moving average, add the MA token three times to the list of tokens, giving each MA it's own specification. Then re-name the MA tokens MAa, Mab, and MAc. Finally, edit the formula to read.
MAc(MAb(MAa(RSI)))
Click the "Save" button to save the revised definition of TRIPLE_MA_RSI, Investor/RT will automatically update the chart with the revised custom indicators, evaluate for formula, and redraw the chart using the new definition. Built-in indicators can be used either as tokens in RTL expressions, as in:
(MA + CL)/HI
or they may be used (invoked) to operate on any arbitrary RTL expression as in:
MA( (HI + LO)/2)
In the first case ((MA + CL)/HI), the MA is calculated using the instrument data in the chart. In the second case, MA is followed immediately by a left parenthesis. This indicates that the MA technical indicator is to operate on the RTL expression that follows (not on the instrument data itself). So Investor/RT first calculates an array of data using the formula (HI + LO/2) and then it calculates the moving average of that array using the specification for MA, and draws the result. The statistical functions (MIN, MAX, AVG, SUM, and STD) have been revised in Investor/RT 4.0 to behave much like built-in technical indicators. (The SUM function is new in 4.0). These functions take two parameters, an RTL expression and a number representing the number of periods. For example MAX(HI, 5) graphs as a line where each point on the line is the maximum HI in the preceding five periods. The formula SUM((RSI > 70, 9) draws a line that tells how many times the RSI has been over 70 during the preceding 9 periods. The statistical functions can also be used to operate on any RTL expression, for example:
MAX( (RSI(MA(HI)), 5)
In this example, Investor/RT first calculates the moving average of the HI prices and then calculates an RSI on that moving average. Finally the MAX function is evaluated to draw a line showing the maximum RSI value calculated in the preceding five periods. RTL has been extended to recognize the same extensions when composing scans. In other words, custom indicator calculations can also be used in scan requests to test for trading signals. For example the scan:
MAX( (RSI(MA(HI)), 5) > 70
finds all instruments having a MAX RSI of 70 or higher in the last 5 periods. If you add that scan to chart using the Scan technical indicator, Investor/RT will display markers on the chart wherever the RTL expression is true. Similarly, SUM ( (RSI > 70), 21) > 10 finds all instruments whose RSI has exceeded 70 in at least 10 of the preceding 21 periods. A word about efficiency Where possible always use built-in technical indicators because they calculate much faster than custom indicators. For example, the custom indicator RSI( (HI+LO+CL)/3) will draw the exact same line as the built-in RSI indicator, assuming the built-in indicator is setup to operate on the HLC/3 price. In the triple smoothed RSI example above, the custom indicator:
MA(MA(MA(RSI)))
can be made more efficient by writing it as:
MA(MA(RSI))
assuming you setup RSI to calculate and perform the first smoothing using the same smoothing parameters as MA uses. Using Relational RTL Expressions in Custom Technical Indicators As indicated in a few of the examples above, relational RTL expressions (those involving comparison operators like less than or greater than) can be used in custom indicators. The formula:
SUM( (RSI > 70) , 9)
for example, first evaluates:
RSI > 70
for each point in the chart. Conceptually, this produces a series of data points where 0 indicates the condition is false and 1 indicates true. The SUM( x, y) function then sums these zero and one values for the preceding 9 periods for each point in the graph. The result will be a line whose value ranges between 0 and 9 where each point on the line tells you how many times in the preceding 9 period that RSI has been above 70.
New in 7.3 In the preferences for the "Custom Indicator" indicator, there are three choices for how zero values are to be handled during the drawing of the indicator.
-
"Connect All Values" simply means to draw the indicator line without any special consideration for zero values.
-
"Connect Non-Zero Values" results in drawing the indicator as if the zero values were not present at all, i.e. all non-zero values are connected by a line, the line being flat over periods of time when the indicator is zero.
-
"Connect Consecutive Non-Zero Values" calls for the custom indicator drawing to be suppressed during periods when the indicator is zero, i.e. only consecutive non-zero values are connected.
Consider for example the custom indicator MA * (CL >= MA), where MA is some moving average. This indicator will have the value zero during periods that the close of the bar is below the moving average; otherwise the indicator value is simply the MA itself. If you put this custom indicator into a chart pane by itself using the new (third) drawing option, the line will be visible only during periods that CL >= MA. If you add the same moving average to the same pane directly using a different line drawing color, the overlaying effect of the MA and custom indicator will give you a two-color line effect with the MA values filling in the periods of time when CL < MA. A more detailed tutorial on utilizing this new drawing option to, in effect, provide a "PaintBars" feature for custom indicators can be found here.