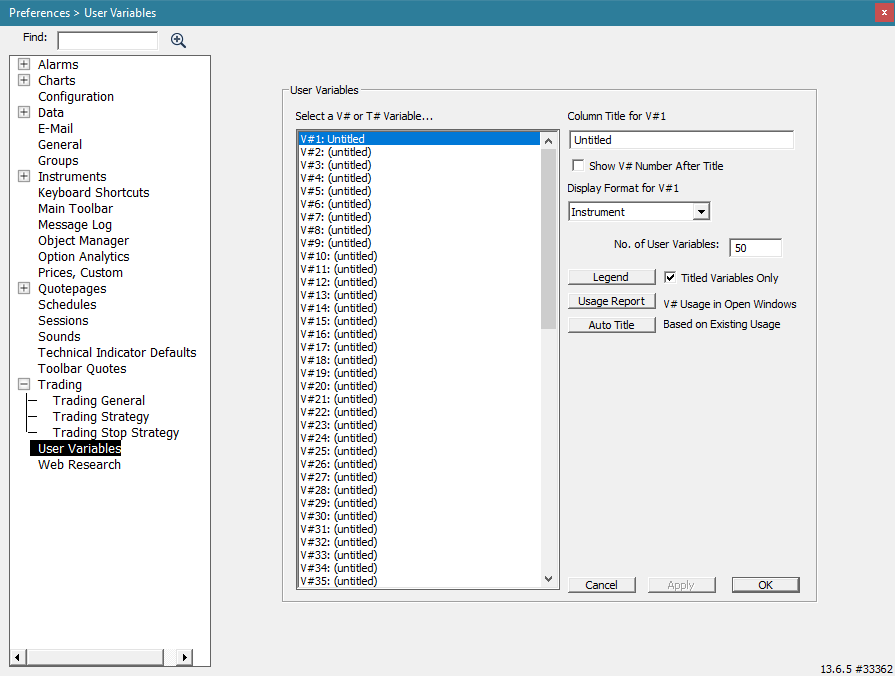
Every symbol has up to 512 available User Variables (V#1, V#2, ... V#512) which can be used to store data specific to that symbol. User Variables have become useful in a variety of ways in Investor/RT. As quotepage columns, their values can be adjust manually directly in the quotepage cell. Values can be set for an entire quotepage with a single scan (e.g. SET(V#1, CCI)). Reference lines can be attached to user variables. Each variable can be assigned it's own custom title (which shows up in quotepage columns) and display format (2 decimal, 32nds, etc). Variable values can be displayed in chart annotations. Custom Columns can be setup to dynamically feed their value directly into any user variable. All user variables are saved on the database and retain when restarting the program. User variable values can also be imported from external text files. To open the User Variables Preferences window, go to File > Preferences > User Variables:
Adjusting V# Column Properties in a Quote Page
If you have one or more V# user variables as columns in a quote page, you can easily adjust the column title or the precision of the display format by right-clicking on any cell in the V# column. Macintosh users control-click. This takes you to the User Variables window for that V# user variable. Make the adjustments and click OK. The quote page will then reflect the changes.
Importing V# Values Using Text Files
The Import facility located at Data > Import Data has been enhanced to allow values for any V# user variable to be imported. For example, externally acquired fundamental data or calculated data of any kind could be imported in this fashion. Then the imported V# values for each instrument can be used in scans, custom indicators, signals, etc. Use the "Current Quotes" option when importing. Create a "Format" that includes the ticker and the V# variables to be imported. Note that at present only V#1 through V#6 values are retained permanently for each instrument on the database when Investor/RT quits. Thus, values imported for other V# variables must be re-imported when Investor/RT starts up again. In fact, you could use the import format to open the .all symbols quote page in this format, then save the page as text. This will save the ticker and each V# value to a text file that can be easily imported at any future time those values are needed for some purpose. Note that "exporting" V# values is not accomplished using File: Export. File: Export is for exporting historical data of any periodicity. File > Save > Save as Text is used to save a quote page of instrument data as a text file. Saved quote page text files can be imported using File: Import.
Data values from outside sources for each ticker can now be imported into user assigned V# variables so that the data can be used for reference in quote pages, scans, etc. The data values must be numeric data. To import numeric values simply setup a format using Setup: Formats. For example, suppose you had a text file in the following format: AAPL,1.11,2.22,3.33 IBM,4.44,5.55,6.66 MSFT,7.77,8.88,9.99 Etc. Each line in the file in this example contains a ticker symbol followed by three numbers, all fields separated by commas (or tabs). Setup a format and name it "Import Three Numbers". The format could be "ticker, V#1, V#2, V#3" for example. Then use File: Import to import the data. Specify "Current Quotes/Other Data" as the Import Type. Specify "Import Three Numbers" as the format to use. When you import the data, variable V#1 will receive the value 1.11 for AAPL, 4.44 for IBM, and 7.77 for MSFT. Note that the Import format you use can include any V# variables, V#1 through V#512. However, only V#1 through V#6 are saved permanently on the database when you Quit Investor/RT. V#7 through V#512 can be used as temporary variables for holding imported data, but these variable are reset to zero when you quit. If you want to preserve the value of V# variables higher than V#7 when you quit, simply create a quote page format containing the ticker followed by V#1 variable columns you wish to preserve. Open the .All Symbols quote page and put the .All Symbols page into this format. Then Issue the File: Save as Text command to save all of the data as a text file. This text file can be imported back into Investor/RT at a later time using File: Import as described above. The format you used to "Save as Text" is the format you should specify when you import. Thus, this new capability to import V# variables makes it possible to extend Investor/RT to save all of your V# variables permanently with a little setup work.
Testing Multiple Custom Column Conditions
Each custom column, whether it references a built-in column, a scan or signal, a custom indicator or a technical indicator has a value for each instrument that changes over time. Scans and trading signals are true/false expressions that have a numeric value of 1.0 (true) or 0.0 (false). If you want to make the calculated value of some custom column available to other scans/signals/custom indicators (and hence to other custom columns) then you can specify a V# user variable for the custom column using the "Calculation" tab of the Custom Column setup window. Suppose, for example you had three custom columns each showing some moving average. You could use, say V#10 for one moving average column, V#11 for another, and V#12 for the third one. The values for V#10, V#11, and V#12 will change dynamically as the custom columns are recalculated. Thus, you can rely on these value to create a custom indicator such as: (CL > V#10) + (CL > V#11) + (CL > V#12) Make another custom column to show the value of this custom indicator. The formula will evaluate to 3 if an instrument's last price is above all three moving averages, 2 if above only two moving averages. A zero value indicates the last price is below all three moving averages. Rules for each value 0,1,2, and 3 can then color code the custom column. Notice there is very little processing involved in evaluating this custom column since all of the moving averages are pre-calculated and available via the V# user variables. This is a very powerful mechanism. Any custom column calculation can essentially pass its results using a user variable to any other column, which in turn considers the V# variable in it's own formula. Note that the calculation order of cells for each row in a quote page is left to right, thus the custom columns should be arranged in such a way that any dependent columns be to the right of the column(s) that produce the V# results it needs. Note also that any custom indicator or scan/signal can also include SET statements in their formulas. User variables set in this fashion are similarly available to other calculations going on in other custom columns within any open quote pages.
Using V#'s with Custom Instruments
Components of custom instruments can now make reference any V# variable. Choices for the "Price" value used in a custom instrument component now include all V# variables. This enhancement opens up literally any user defined computation to tracking as an instrument using references to V# variables. By setting up a scan to periodically calculate some V# variable for one or more instruments, you can then define a custom instrument that sums the V# values for the instrument(s) and track the resulting summation.
V# Variables In Portfolios
V#n variables are now available for display as columns in portfolios as well as quote pages. To add a column to a portfolio, right-click (control-click if Mac) on any column heading and pick "Add New Column" from the popup menu. The twenty V# variables are all listed (under V) in the alphabetical list of available columns. The current column title, if assigned, will be shown in the list of columns as well. Note that at most 30 columns can be present in a portfolio (or quote page) so you may have to remove an unneeded column before you can add a new one.
V# Variables User Editing
When a V# user variable is present in either a quote page or portfolio, the numbers are editable. This enables you to use V# variables for user entered values, e.g. a hand-entered "target price". This opens up lots of new possibilities for scans that incorporate V# variables, reference lines based on V# variables, etc. Formerly, V# variables could take on a value only when the V# variable was the subject of a SET command in a scan.
Horizontal reference lines can be based on RTL-calculated values
The horizontal reference line technical indicator has been enhanced to allow the reference line to be pegged to any of the twenty V# user variables in the RTL language. See the discussion of Pivot Point above. Another example would be to use a scan to set a V# variable to a moving average calculated using Daily data and then setting up a reference line in an intra-day chart to draw at the price level set into the V# variable. To setup a reference line this way, check the radio button titled "Use" and choose the V# variable from the list provided. Using an auto-scan, the value of a V# variable can be calculated periodically during the trading session, causing the reference line to move accordingly as the value of the V# variable changes.
Backtesting improvements made to "Rule Price"
To provide additional user flexibility menu choices for "user variables" V#1 through V#512 have been added as "Rule Price" options. What this means is that trading rules can set the value one or more V# variables and a particular V# variable can be used as the rule price to enter or exit a position. When a V# variable is used as an entry or exit price is a rule, Investor/RT will check to see if the value of the V#1 is between the high and low extremes for the particular bar when the rule is being tested. If so the V#1 variable will be used "as is". If the V# variable is higher than the high of the bar, then the high price of the bar will be used in space of the V# variable. Similarly if the V# variable is lower than the low of the bar, the low will be used to enter or exit the position.
Collecting Historical Data for RTL Calculations
The SET command in the RTL language provides a means of setting any calculated value into a custom variable V#1 through V#512. These values can be viewed by adding the appropriate V# columns to your quote pages. Investor/RT Version 4.4 provides a new twist to the use of V# variables: a method for recording the results of any such calculation historically. This new capability is best explained by way of example. Suppose you want to track the tick velocity (ticks per minute) for some instrument or group of instruments. This can be done by running an auto scan to periodically calculate the TV (tick velocity) indicator. The scan formula would be simply: TV > 0 Using one of the new custom variables you can revise the scan to read: SET(V#1, TV) Running this scan periodically with auto-scan (say once a minute) causes the V#1 data column in any open quote pages to update dynamically for each scanned instrument. The V#1 quote page column shows the tick velocity of each instrument. To inform Investor/RT that you wish to record the values of tick velocity over time, you must define a special instrument to Investor/RT having a ticker symbol in a prescribed format. The purpose of the special instrument is to "hold" the collected data. The ticker symbol must have the format: "xxxx(V#n)" where xxxx is a valid ticker symbol and n is a number from 1 to 12. For example "INTC(V#1)" would be the ticker of a special instrument that tracks the values of V#1 for INTC over time. Each time Investor/RT executes a SET(V#1, ...) command for INTC, the computed value that is "set" into V#1 is used generate a "tick" for the ticker symbol INTC(V#1). The ticker symbol "INTC(V#1)" is just like any other instrument in Investor/RT. You can chart it, view it in a quote page or quick quote window, or view each tick in a time and sales window if you like. All of the charting facilities of Investor/RT can be used to watch INTC(V#1) throughout the trading session. You can view technical indicators on INTC(V#1), e.g. add a moving average to the INTC(V#1) chart so see a smoothed tick velocity line. In summary, the "Auto Scan" feature of Investor/RT in concert with the SET command causes updates to occur on any special instrument you have defined. This is a very powerful new capability. An auto scan can be used to calculate several V#n variables periodically while the instruments with ticker format "symbol(V#n)" are used to track the results intra-day. For example: SET(V#1, TV) and SET(V#2, CL/CL(INDU)) and SET(V#3, CL/CL(SPX)) This scan calculates the tick velocity and the price of an issue relative to the Dow Jones Industrial Average and the S&P 500 Index. For any symbol scanned you can create the tickers symbol(V#1), symbol(V#2) and symbol(V#3) to track the intra-day values of the three V# variables.
See Also
- User Variables (aka V# Variables)
- Chart Variables (aka C# Variables)
- Text Variables (aka T# Variables)