See Also: Raw Tick Chart Prefences
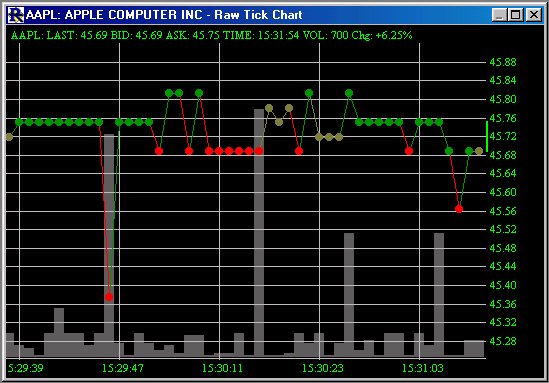
The Raw Tick Chart provides a new perspective for viewing real-time ticks in Investor/RT. The chart does not consider the time elapsed between ticks, but instead places each consecutive tick equal distance apart.

The tick chart overlays an optional volume histogram which provides a quick look at the volume for each tick. A message box at the top of the chart provides feedback on the last tick price, volume, time, bid, ask, and percent change. By moving your mouse pointer across previous ticks on the chart, the message box will give you information about those ticks. A small line in the vertical scale provides you with the bid/ask spread. The different color ticks represent buy ticks(ticks that traded at or above the ask - in green above), sell ticks(ticks that traded at or below the bid - in red above) and neutral ticks(ticks that traded between the bid and ask - in brown above).

