Duration:18:49
Variable speed version:
Watch
What is the average range and volume of the initial balance, the overnight period, the day session, the 24hr session? How often does price open above/below previous day session range? What is the relationship of overnight direction to day session direction and visa versa?
See the follow up video on 2/24/2012 which shows how to count the number of days where the IB was less than 4 and how to quickly compute the average daily range of those small IB days using a new Signal Statistics result: Count Small Initial Balance of which you can view the chart definition below.
- These statistics are based on 1,000 day period of ES data ending 11/29/2010
- Avg Range: Day Session =20.25, 24hr Session=24.25, Overnight=13.75, IB=10.00
- Avg Volume: Day Session =1.74m, 24hr Session=1.97m, Overnight=236k, IB=404k
- Median Range: Day Session =16.75, 24hr Session=20.25, Overnight=11.25, IB=8.75 (Note: Median was not demonstrated in video - Uses Statistics Indicator).
- Median Volume: Day Session =1.68m, 24hr Session=1.92m, Overnight=217k, IB=397k
- Price Open Above Prev Day Sess Range: 247/1340=18.4% of time
- Price Open Below Prev Day Sess Range: 197/1340=14.7% of time
- Up/Down Relationship: Over a 1000 day period, the day session direction agreed with overnight session direction 29 more times than it disagreed. The relationship of day session direction to the following overnight session direction was insignificant (3 more times it disagreed over 1000 days).
| Range | IB | Day Session | O/N Session | 24hr Session |
| Mean | 10.00 | 20.25 | 13.75 | 24.25 |
| Median | 8.75 | 16.75 | 11.25 | 20.25 |
| Mode | 6.75 | 11.25 | 7.50 | 16.75 |
| Max | 109.00 (05/06/10) | 109.00 (05/06/10) | 82.00 (10/08/08) | 115.50 (10/28/08) |
| Min | 1.00 (02/19/07) | 1.50 (02/19/07) | 2.50 (04/05/07) | 2.75 (05/28/07) |
| (Note: Min is questionable due to holidays and partial sessions.) | ||||
| Volume | IB | Day Session | O/N Session | 24hr Session |
| Mean | 404k | 1.74m | 236k | 1.97m |
| Median | 397k | 1.68m | 217k | 1.92m |
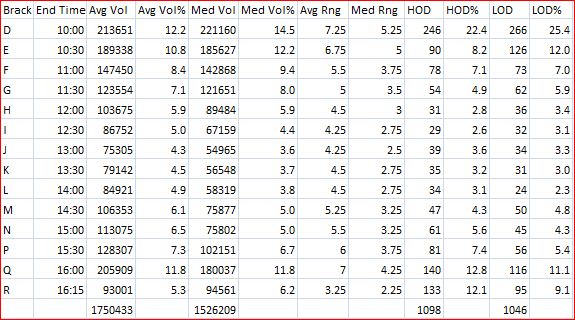
Average Range and Volume Per Bracket... (1000 Days ending 11/23/2010)
Chart Reference
Small IB Count