Duration:19:29
Variable speed version:
Watch
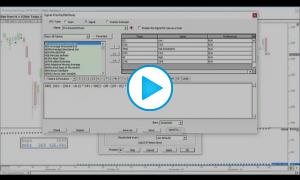
How do I export daily VPOC (Volume Point of Control) to excel along with open, high, low, close and volume for further analysis? How far on average was VPOC from previous day VPOC? How often did price open below/above previous days VPOC? What days had a VPOC very close to previous days VPOC? How often did price open in previous range and touch previous VPOC? How often did price open out of range and touch previous VPOC?
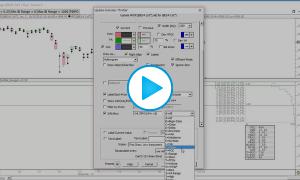
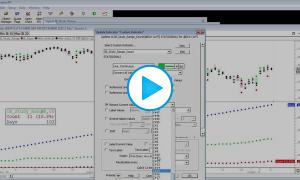
VPOC Statistics Chart Definition Spread Sheet of VPOC Stats
VPOC - Volume Point of Control is the Price at which more volume traded than any other price in the profile. In the context of this video, each profile represents one session. So the VPOC is the price at which the most volume traded each day.
- These statistics were computed over a 1230 day period ending 12/07/2010
- Average distance between consecutive VPOC = 11.68 points (Avg distance between lows = 11.68 also. Avg distance between highs = 10.06. Avg distance between closes = 12.35)
- Opened above previous VPOC: 621/1230 = 50.5% of time.
- Opened below previous VPOC: 595/1230 = 48.4% of time.
- Open on previous VPOC: 14/1230 = 1.1%
- How often did price open close to previous days VPOC?
- within 0.25: 46 (3.7%)
- within 0.50: 71 (5.8%)
- within 1 point: 108 (8.8%)
- within 2 points: 218 (17.7%)
- within 5 points: 468 (38.0%) - How often did price open in previous range and touch previous VPOC? 557 (45.3%)
- How often did price open out of prev range and touch previous VPOC? 150 (12.2%)
- To change the chart to provide 24hr session numbers, simply change the chart to session 31 and the periodicity to 1425 minutes. All stats will then reflect 24hr session data, included exported data.