 |
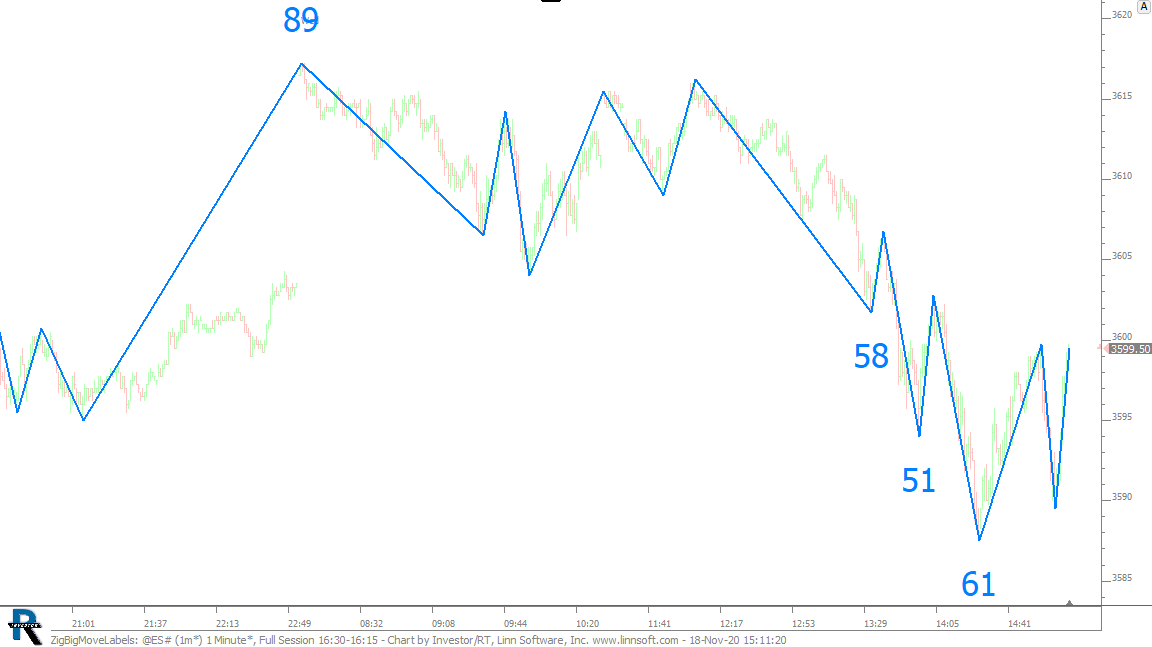
ZigBigMoveLabels (@ES#) cpayne [totalcount]
5 years 7 months ago
This chart was uploaded by Investor/RT 14.2.4 showing symbol: @ES#. |
View |
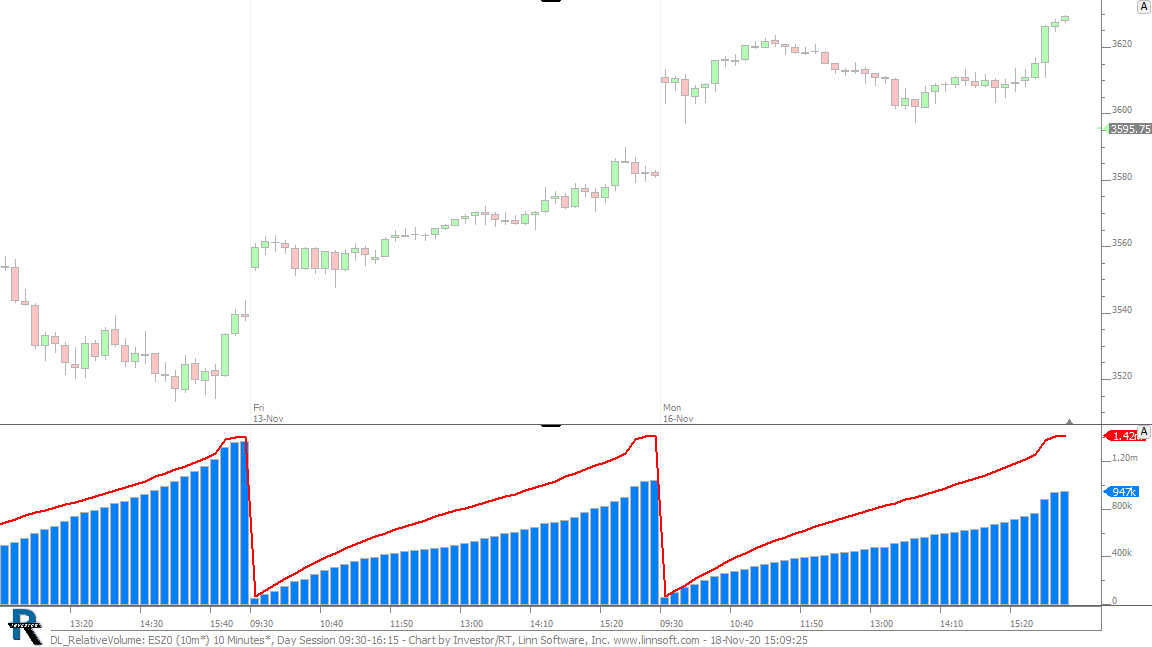 |
DL RelativeVolume (ESZ0) cpayne [totalcount]
5 years 7 months ago
Volume (blue) vs 20 Day Avg Volume (red). This chart was uploaded by Investor/RT 14.2.4 showing symbol: ESZ0. |
View |
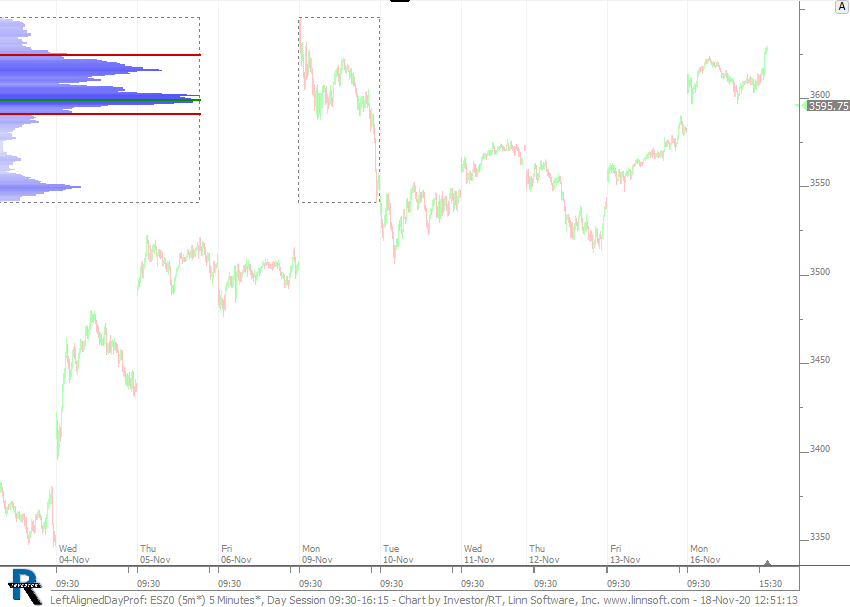 |
LeftAlignedDayProf (ESZ0) cpayne [totalcount]
5 years 7 months ago
This chart was uploaded by Investor/RT 14.2.4 showing symbol: ESZ0. |
View |
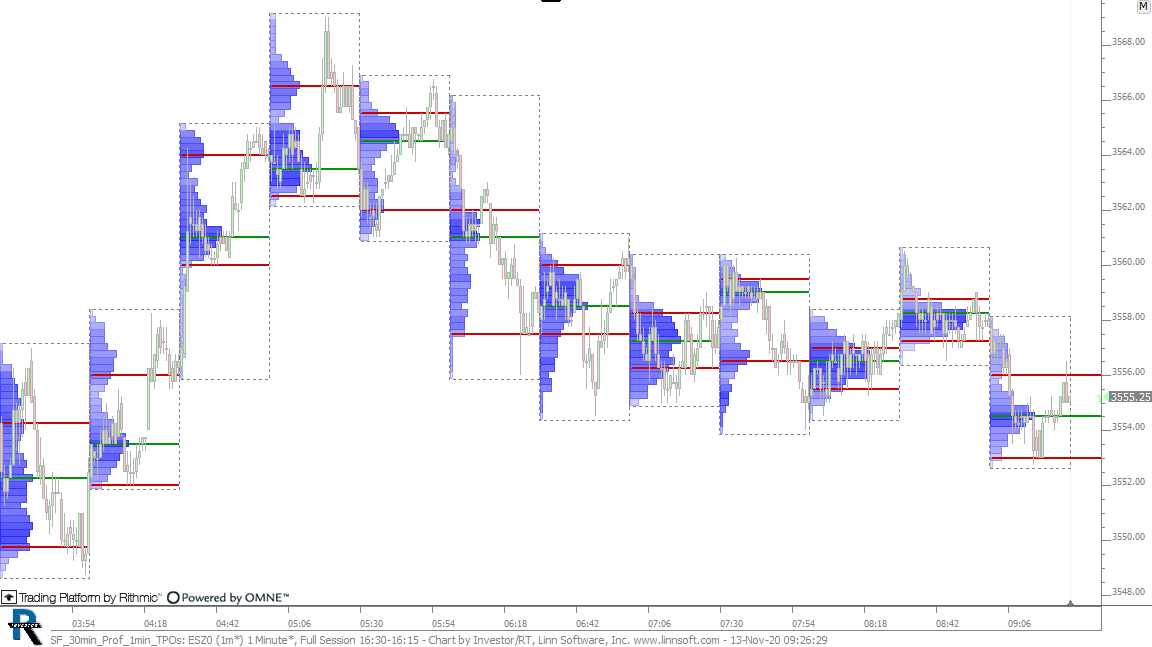 |
SF 30min Prof 1min TPOs (ESZ0) cpayne [totalcount]
5 years 8 months ago
30 Minute Profiles - 1 Min TPOs. This chart was uploaded by Investor/RT 14.2.3 showing symbol: ESZ0. |
View |
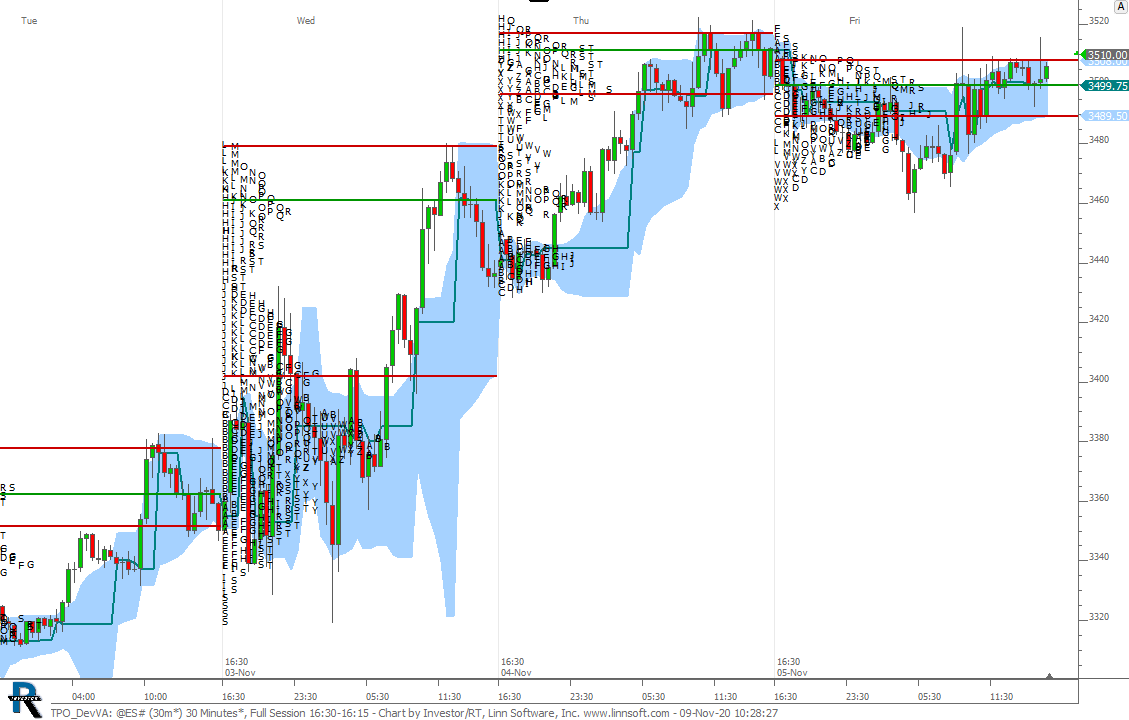 |
TPO DevVA (@ES#) cpayne [totalcount]
5 years 8 months ago
This chart was uploaded by Investor/RT 14.2.3 showing symbol: @ES#. |
View |
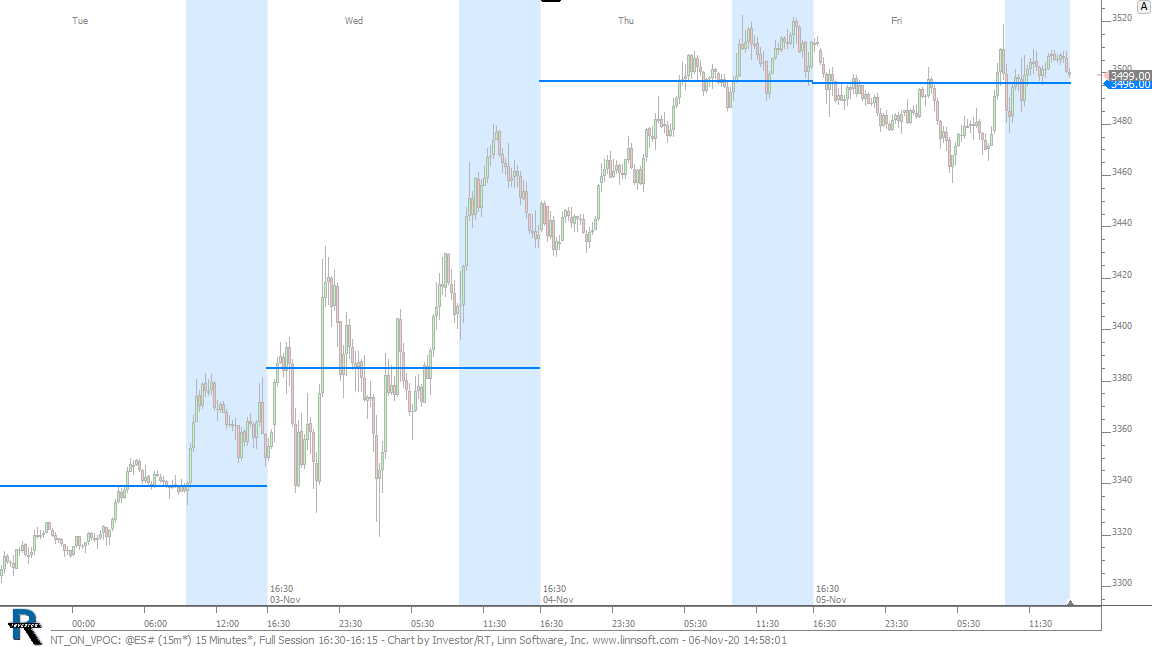 |
NT ON VPOC (@ES#) cpayne [totalcount]
5 years 8 months ago
Overnight VPOC. This chart was uploaded by Investor/RT 14.2.3 showing symbol: @ES#. |
View |
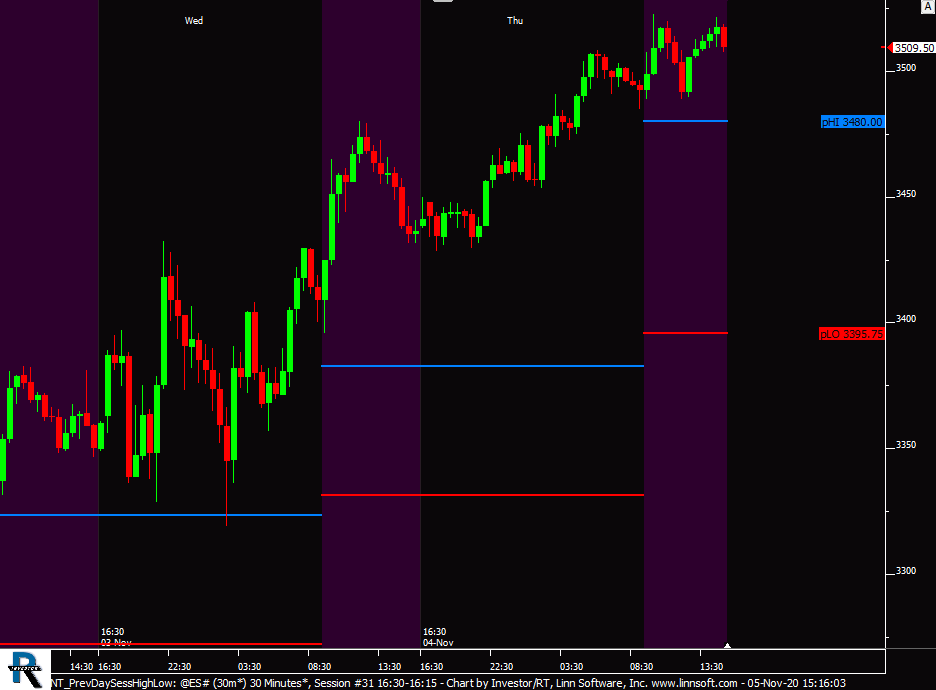 |
NT PrevDaySessHighLow (@ES#) cpayne [totalcount]
5 years 8 months ago
This chart was uploaded by Investor/RT 14.2.3 showing symbol: @ES#. |
View |
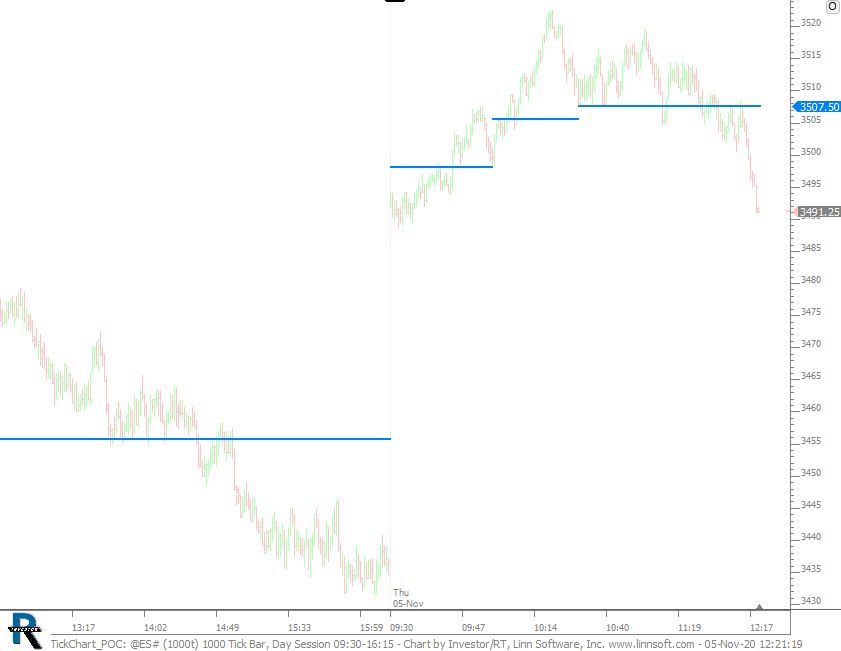 |
TickChart POC (@ES#) cpayne [totalcount]
5 years 8 months ago
Devloping Time-Based POC on Tickbar Chart. This chart was uploaded by Investor/RT 14.2.3 showing symbol: @ES#. |
View |
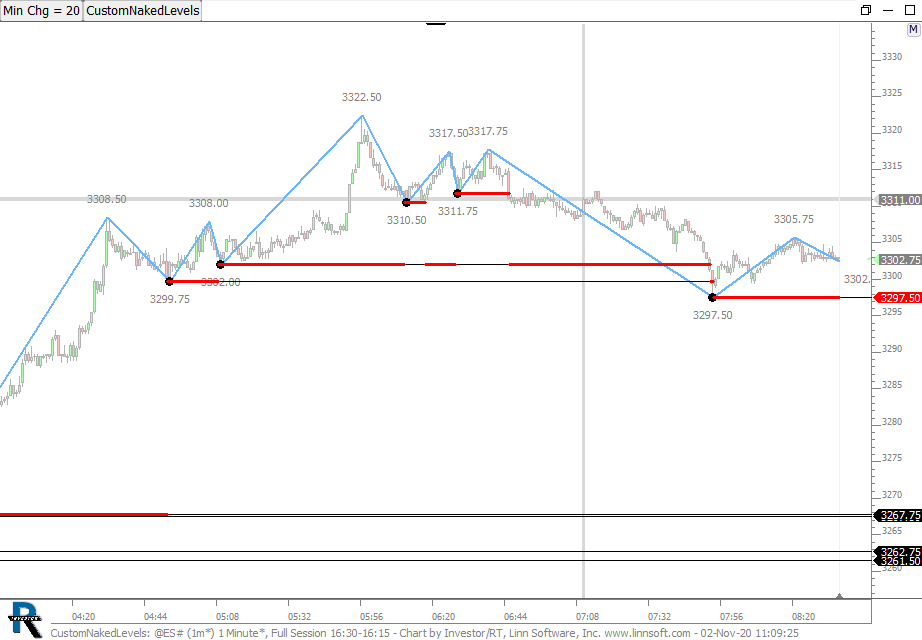 |
CustomNakedLevels (@ES#) cpayne [totalcount]
5 years 8 months ago
This chart was uploaded by Investor/RT 14.2.2 showing symbol: @ES#. |
View |
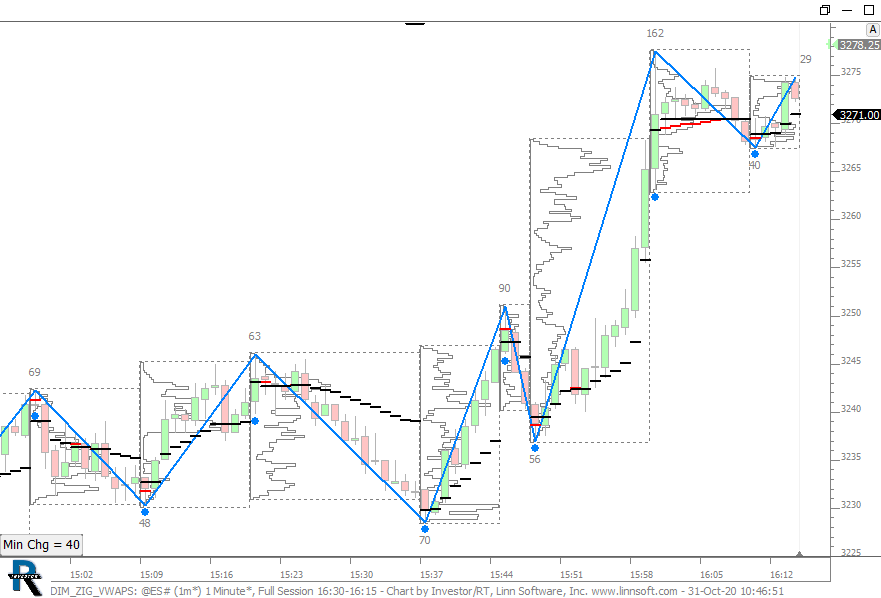 |
DIM ZIG VWAPS (@ES#) cpayne [totalcount]
5 years 8 months ago
This chart was uploaded by Investor/RT 14.2.2 showing symbol: @ES#. |
View |
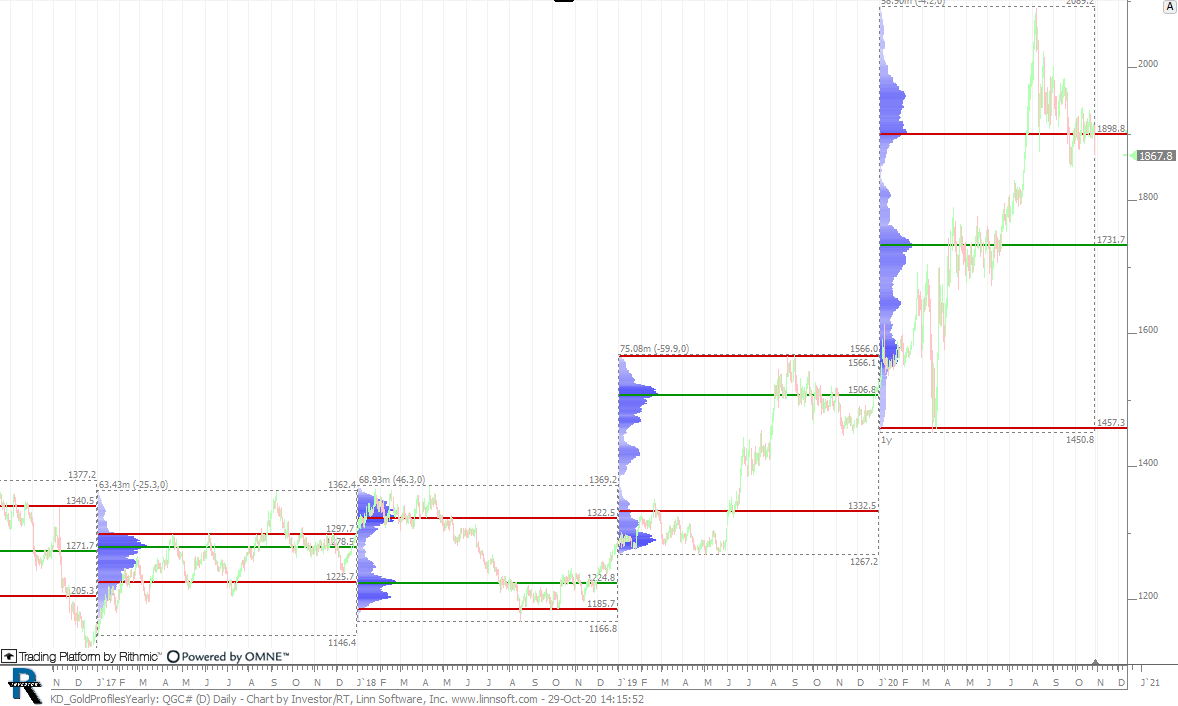 |
KD GoldProfilesYearly (QGC#) cpayne [totalcount]
5 years 8 months ago
This chart was uploaded by Investor/RT 14.2.2 showing symbol: QGC#. |
View |
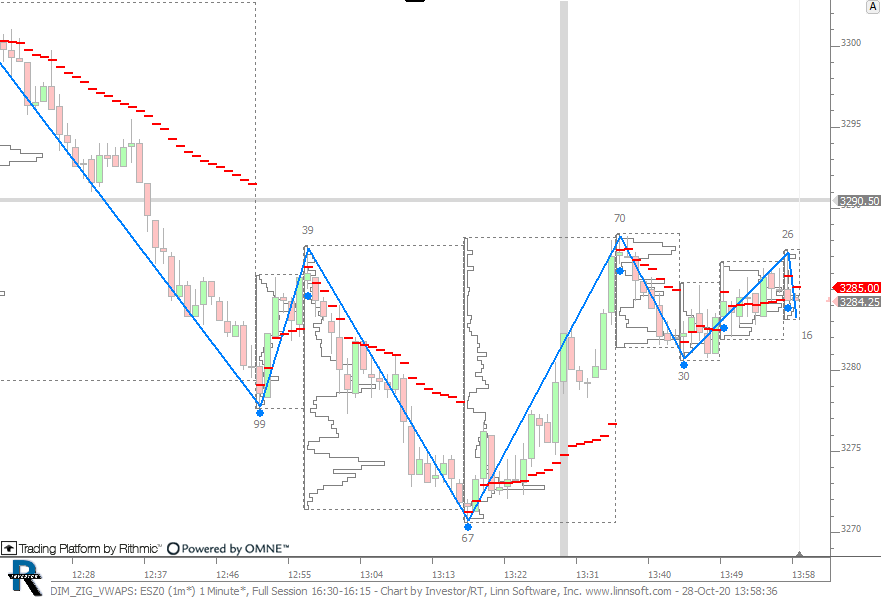 |
DIM ZIG VWAPS (ESZ0) cpayne [totalcount]
5 years 8 months ago
VWAPs of Zig Zag Waves. This chart was uploaded by Investor/RT 14.2.2 showing symbol: ESZ0. |
View |
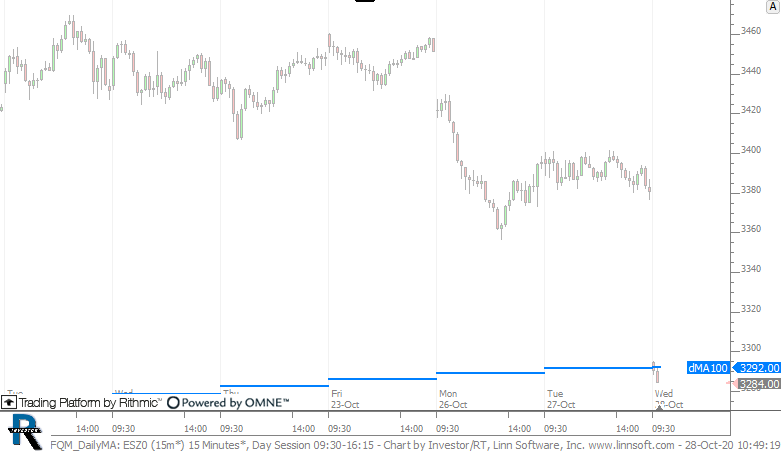 |
FQM DailyMA (ESZ0) cpayne [totalcount]
5 years 8 months ago
This chart was uploaded by Investor/RT 14.2.2 showing symbol: ESZ0. |
View |
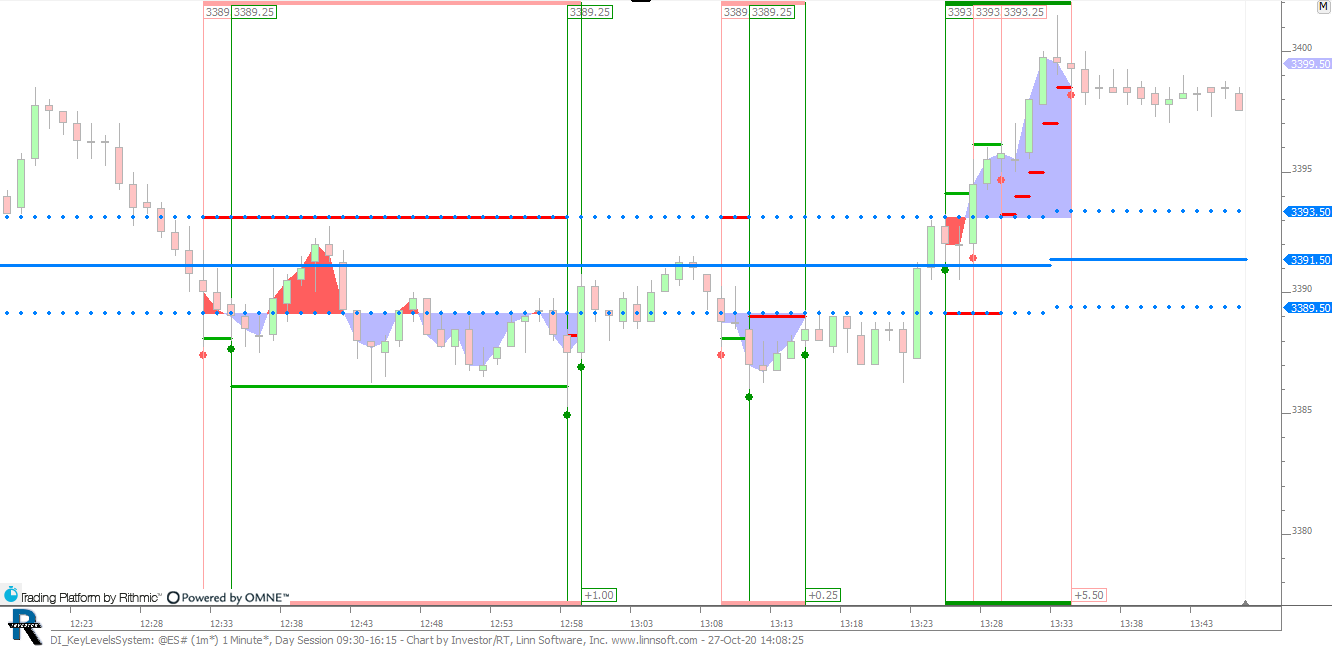 |
DI KeyLevelsSystem (@ES#) cpayne [totalcount]
5 years 8 months ago
Key Level Trading System. This chart was uploaded by Investor/RT 14.2.1 showing symbol: @ES#. |
View |
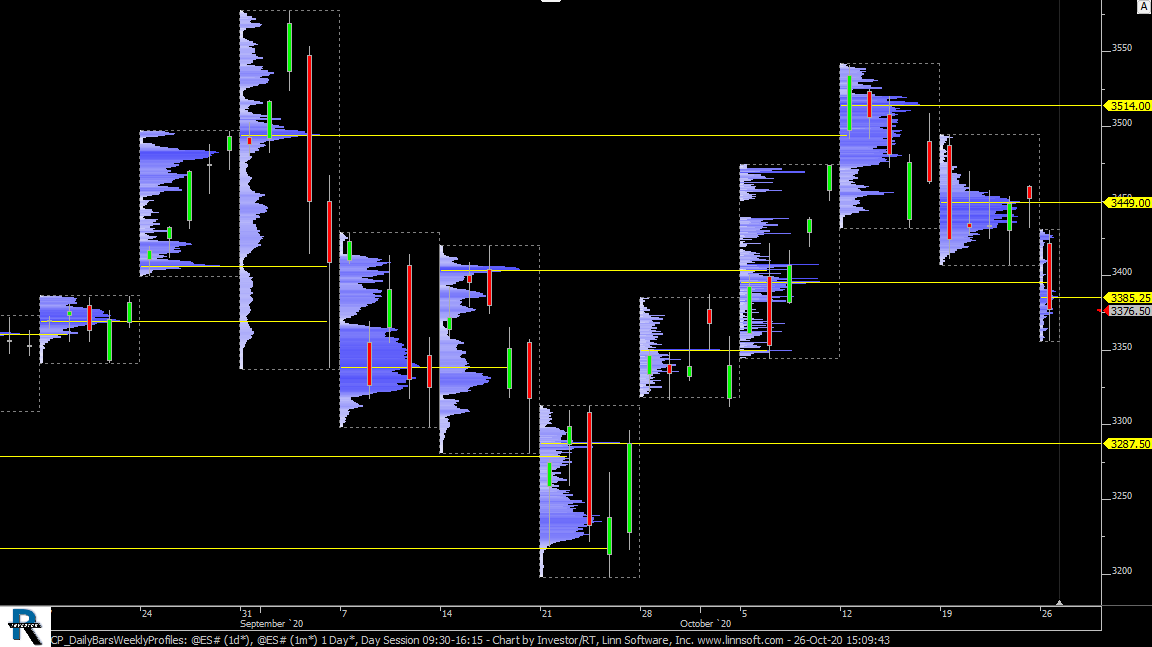 |
CP DailyBarsWeeklyProfiles (@ES#) cpayne [totalcount]
5 years 8 months ago
Daily Bars - Weekly Profiles. This chart was uploaded by Investor/RT 14.2.2 showing symbol: @ES#. |
View |
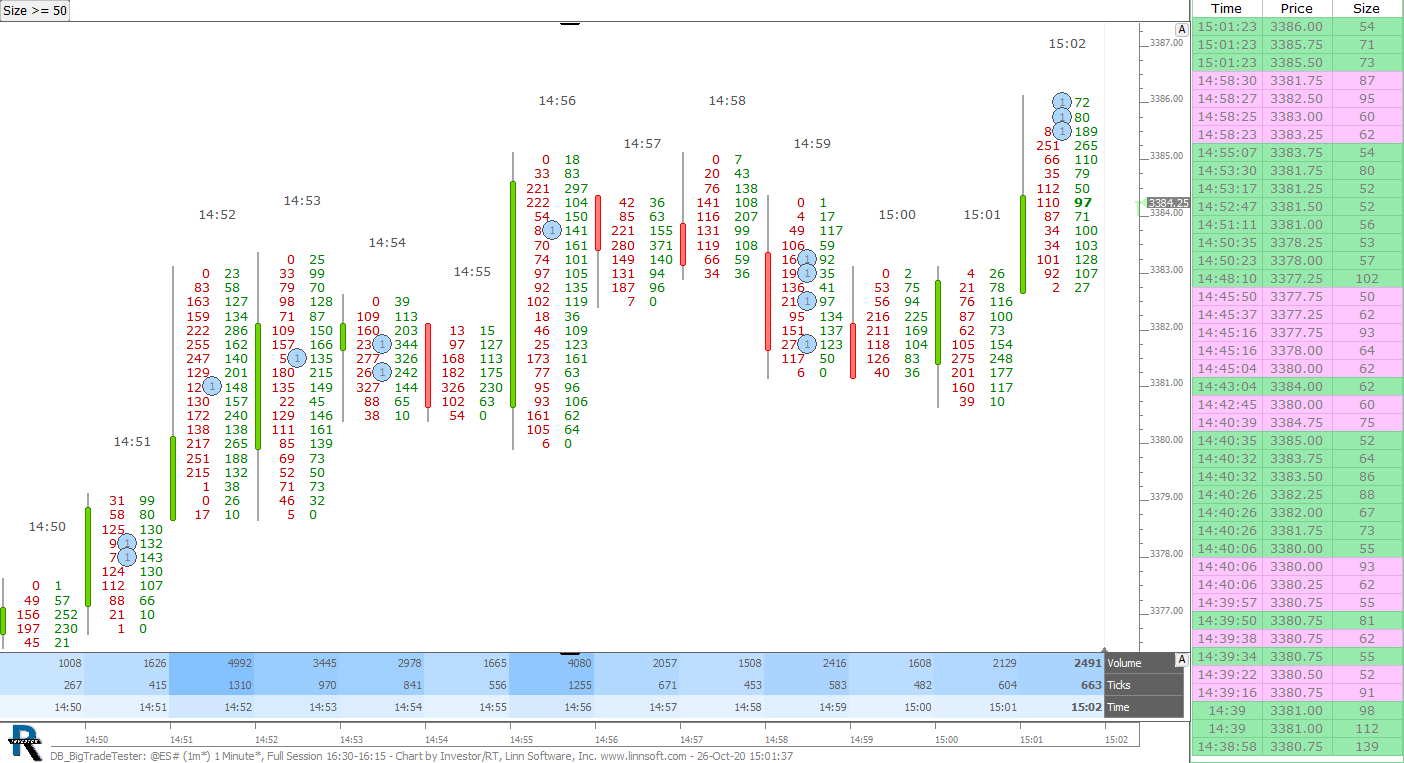 |
DB BigTradeTester (@ES#) cpayne [totalcount]
5 years 8 months ago
This chart was uploaded by Investor/RT 14.2.2 showing symbol: @ES#. |
View |
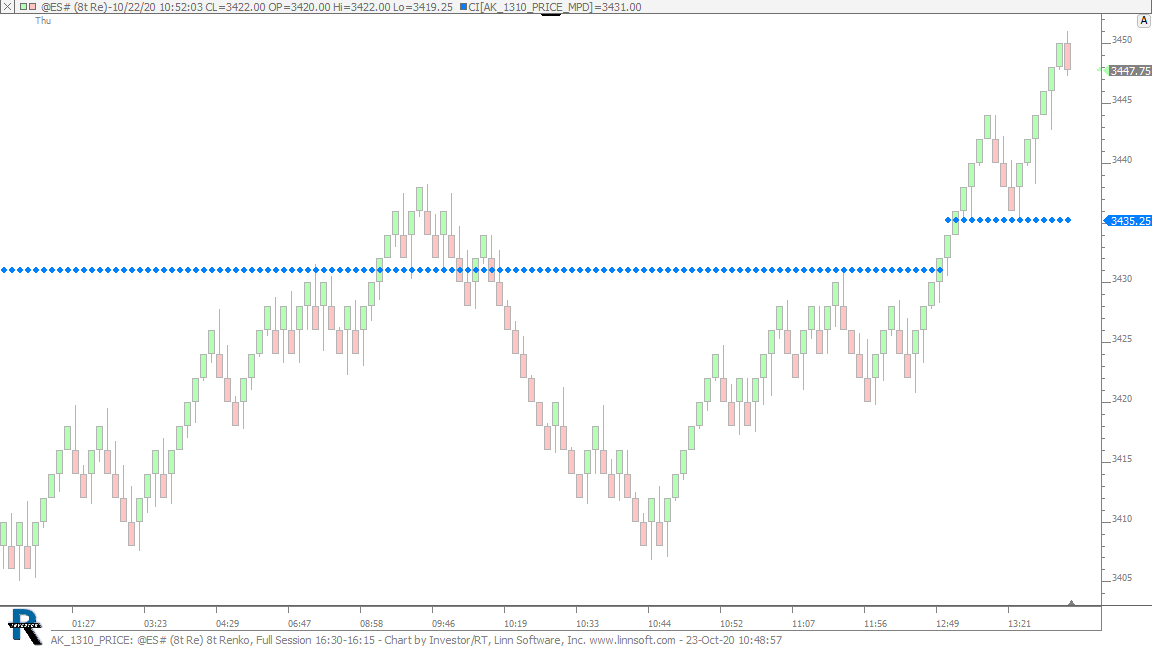 |
AK 1310 PRICE (@ES#) cpayne [totalcount]
5 years 8 months ago
Price at 13:10 on Renko Chart. This chart was uploaded by Investor/RT 14.2.2 showing symbol: @ES#. |
View |
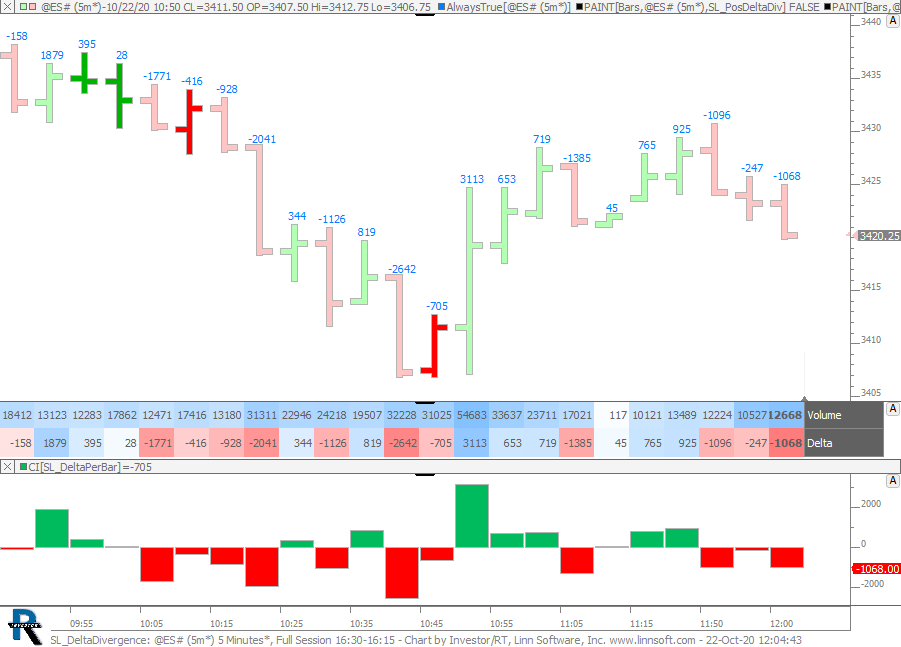 |
SL DeltaDivergence (@ES#) cpayne [totalcount]
5 years 8 months ago
Delta Divergence. This chart was uploaded by Investor/RT 14.2.2 showing symbol: @ES#. |
View |
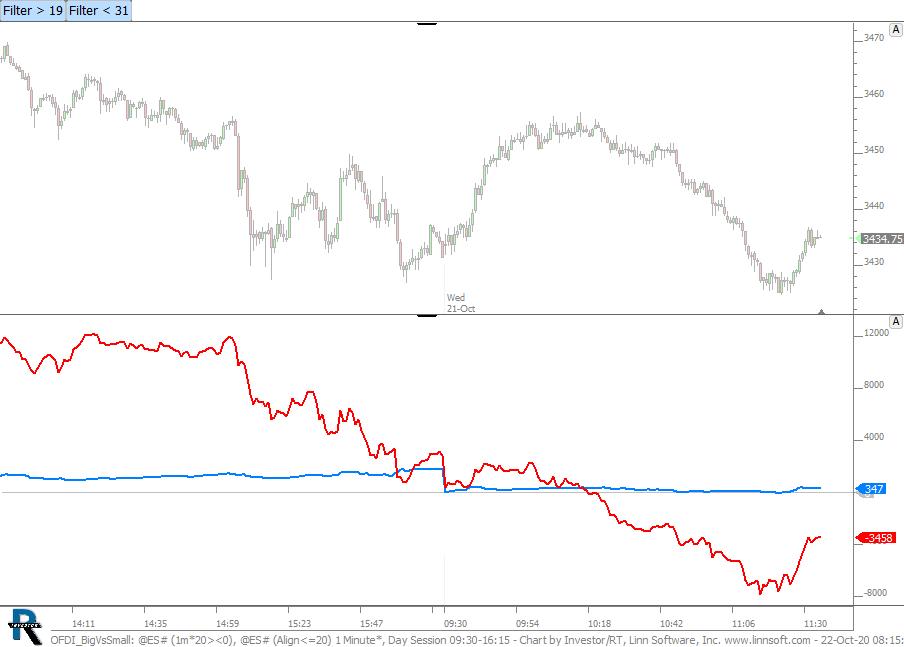 |
OFDI BigVsSmall (@ES#) cpayne [totalcount]
5 years 8 months ago
Cumulative Delta (Day) of big trades vs small trades. Use the button at the top to control the big vs small. |
View |
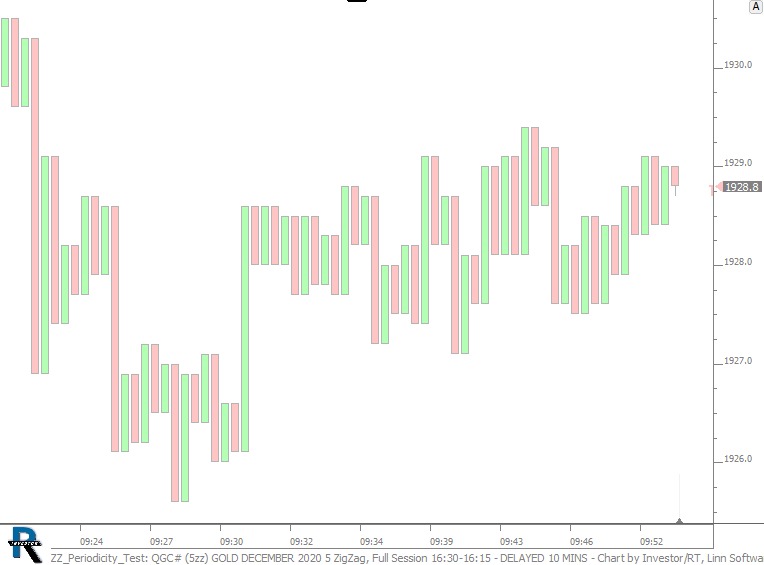 |
ZZ Periodicity Test (QGC#) cpayne [totalcount]
5 years 8 months ago
This chart was uploaded by Investor/RT 14.2.2 showing symbol: QGC#. |
View |
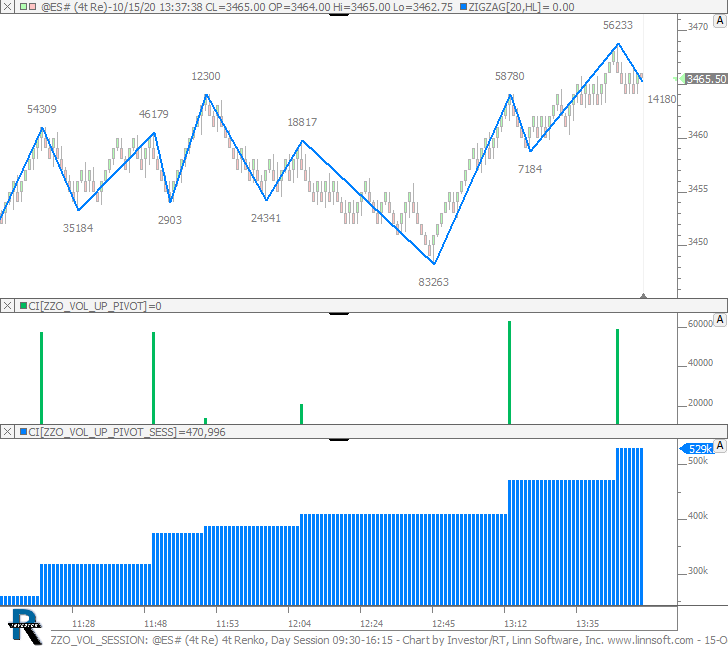 |
ZZO VOL SESSION (@ES#) cpayne [totalcount]
5 years 9 months ago
Sum the Volume of ZZ Up Rotations for the Session. This chart was uploaded by Investor/RT 14.2.2 showing symbol: @ES#. |
View |
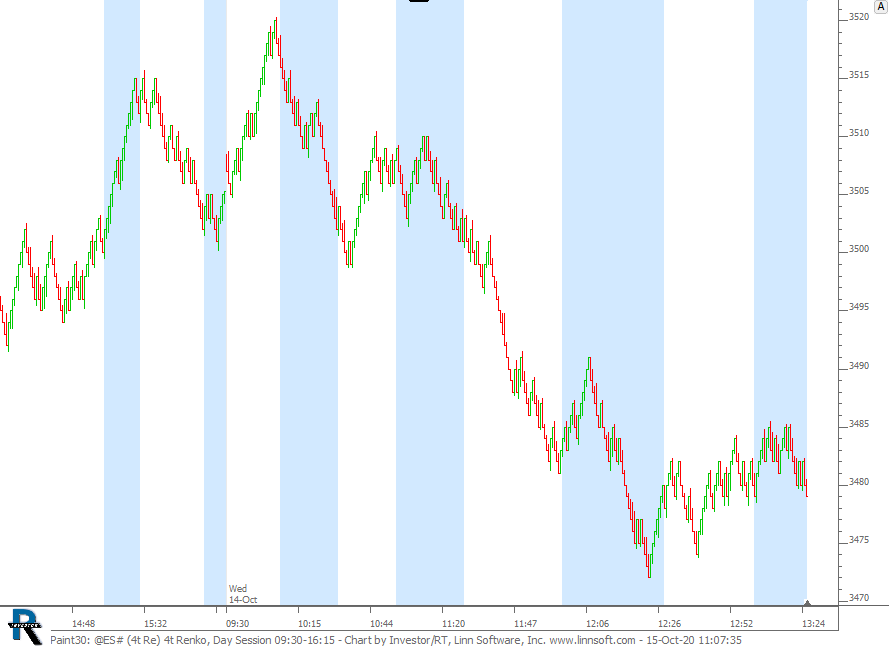 |
Paint30 (@ES#) cpayne [totalcount]
5 years 9 months ago
Paint the background of each 30 minute period with the Paint Bar indicator. This chart was uploaded by Investor/RT 14.2.1 showing symbol: @ES#. |
View |
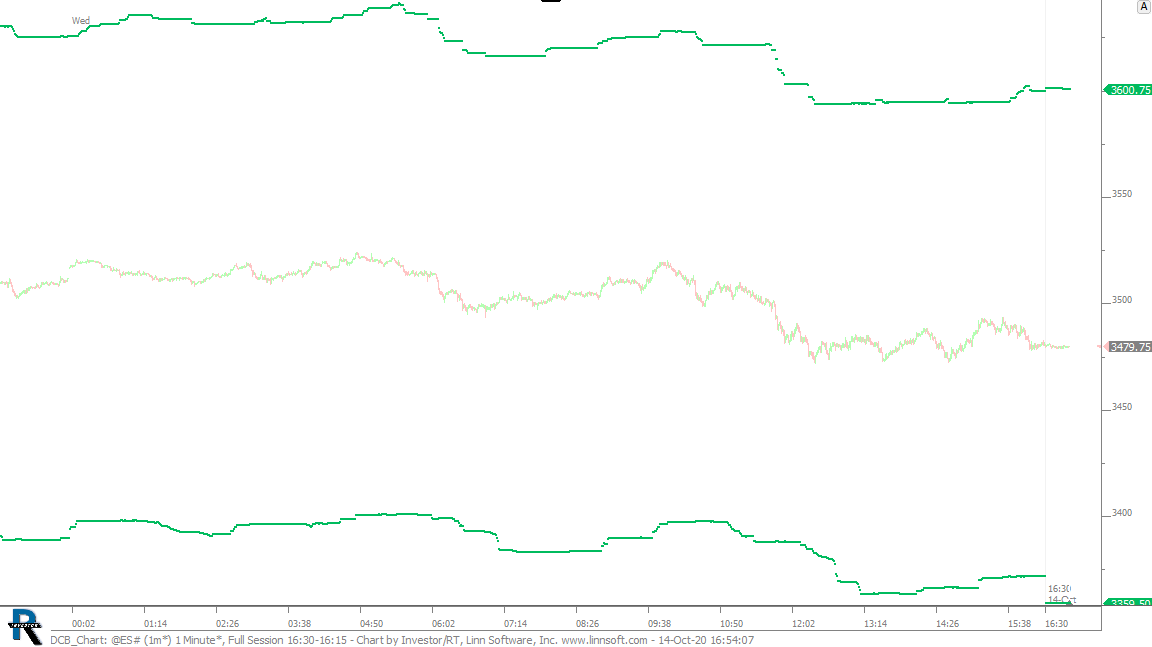 |
DCB Chart (@ES#) cpayne [totalcount]
5 years 9 months ago
This chart was uploaded by Investor/RT 14.2.1 showing symbol: @ES#. |
View |
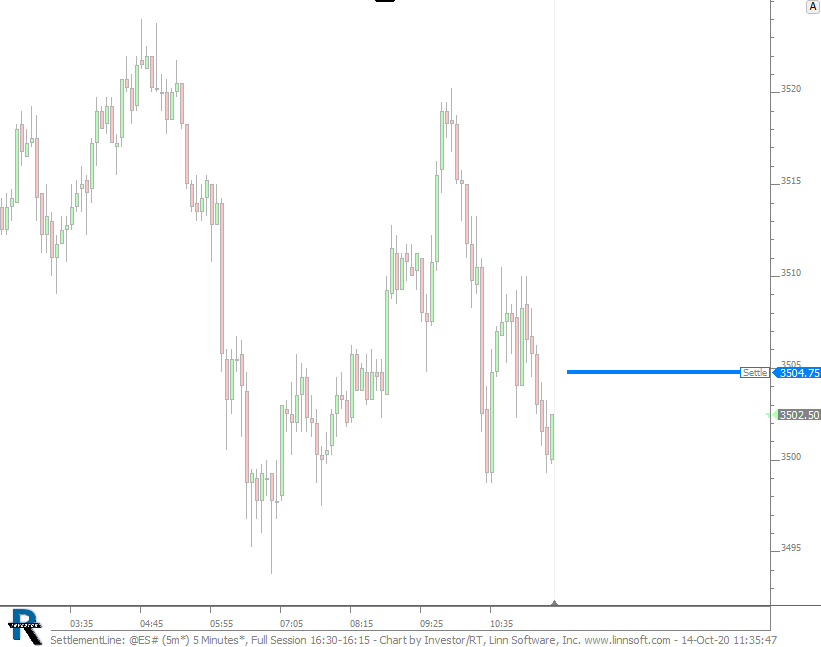 |
SettlementLine (@ES#) cpayne [totalcount]
5 years 9 months ago
Settlement Line. This chart was uploaded by Investor/RT 14.2.1 showing symbol: @ES#. |
View |
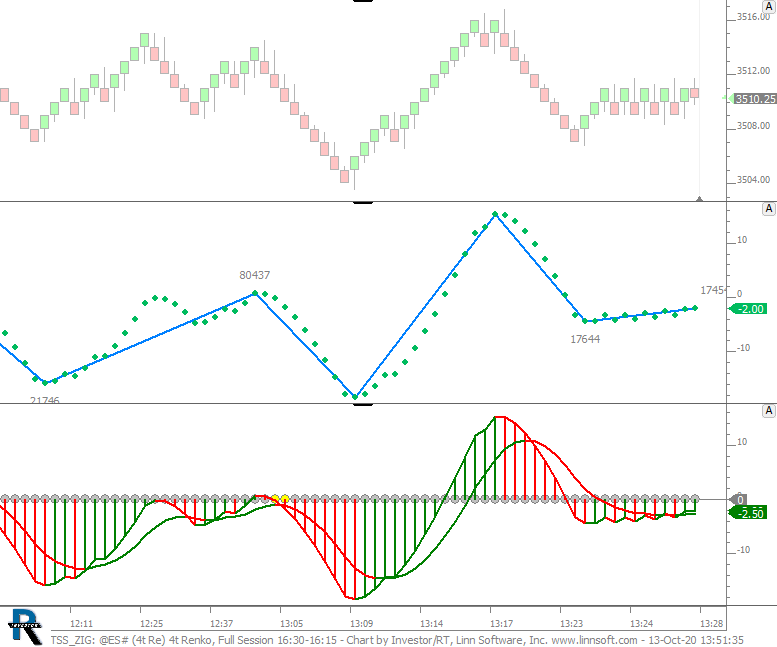 |
TSS ZIG (@ES#) cpayne [totalcount]
5 years 9 months ago
This chart was uploaded by Investor/RT 14.2.1 showing symbol: @ES#. |
View |