 |
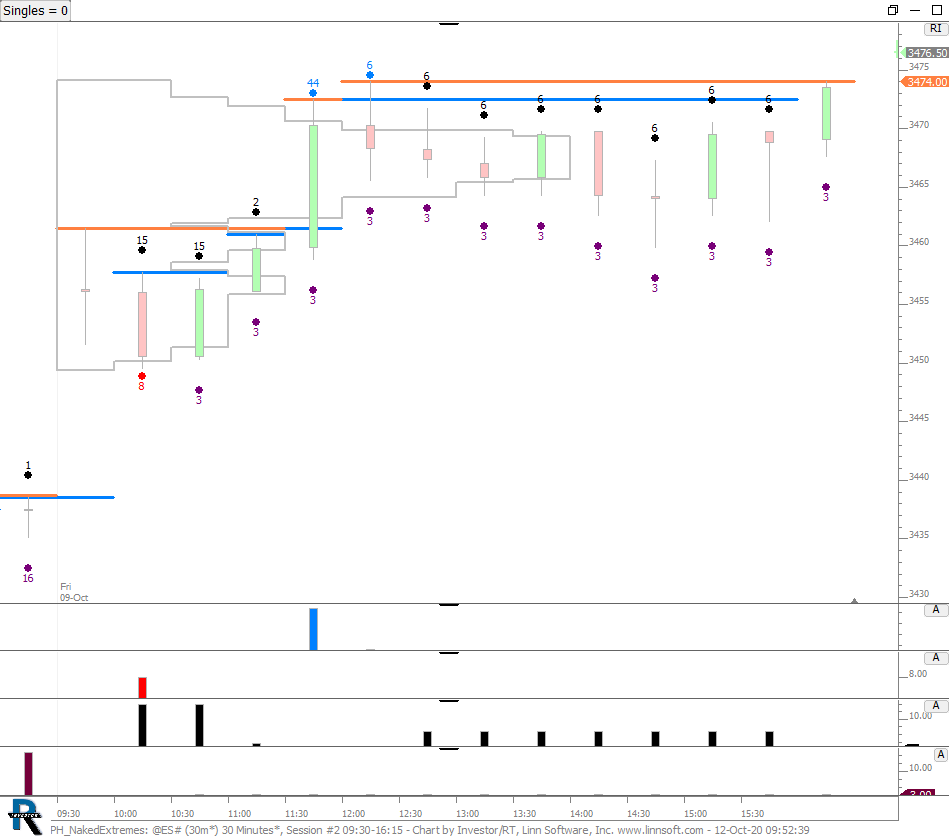
PH NakedExtremes (@ES#) cpayne [totalcount]
5 years 9 months ago
High Singles Alerts and Counts. This chart was uploaded by Investor/RT 14.2.1 showing symbol: @ES#. |
View |
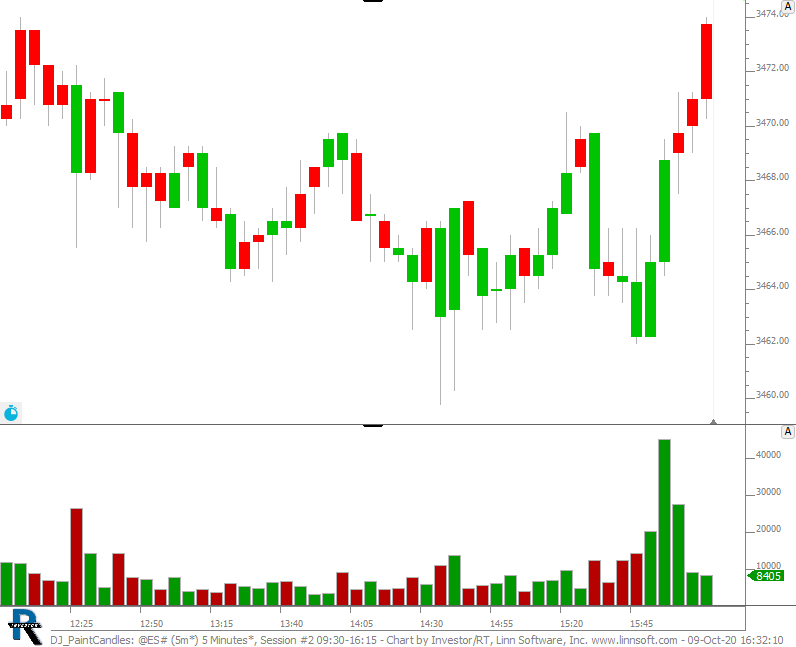 |
DJ PaintCandles (@ES#) cpayne [totalcount]
5 years 9 months ago
Volume painted based on whether the bar closed up or down. Bars pained based on whether volume is up or down. |
View |
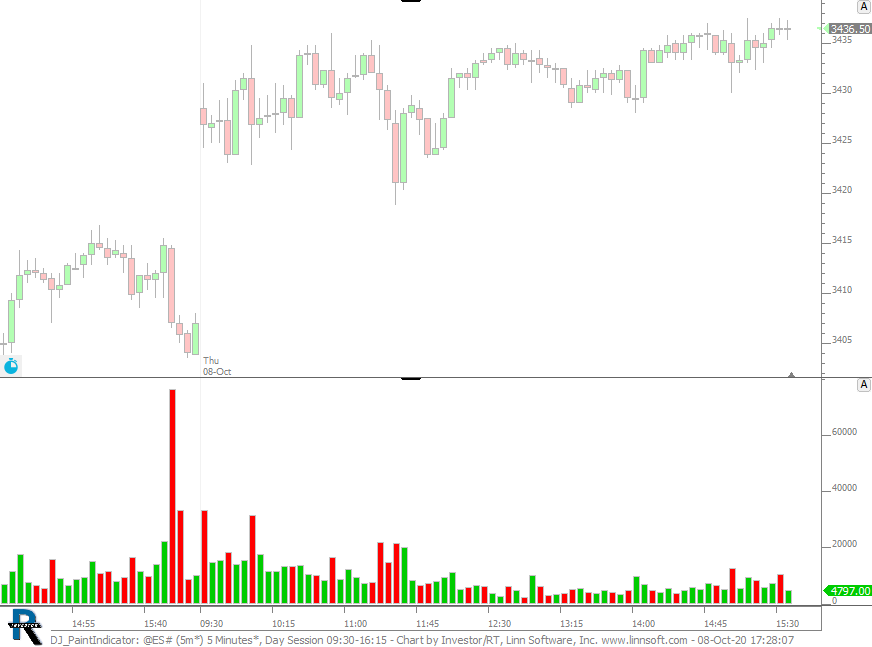 |
DJ PaintIndicator (@ES#) cpayne [totalcount]
5 years 9 months ago
Volume painted based on whether the bar closed up or down. This chart was uploaded by Investor/RT 14.2.1 showing symbol: @ES#. |
View |
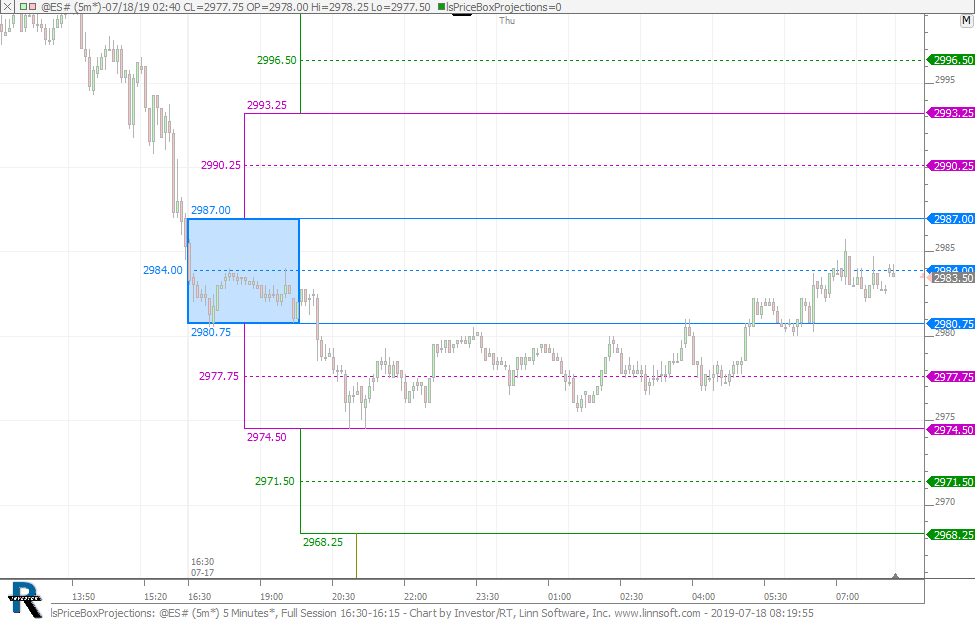 |
lsPriceBoxProjections (@ES#) cpayne [totalcount]
6 years 12 months ago
PriceBoxProjections. This chart was uploaded by Investor/RT 13.6.1 showing symbol: @ES#. |
View |
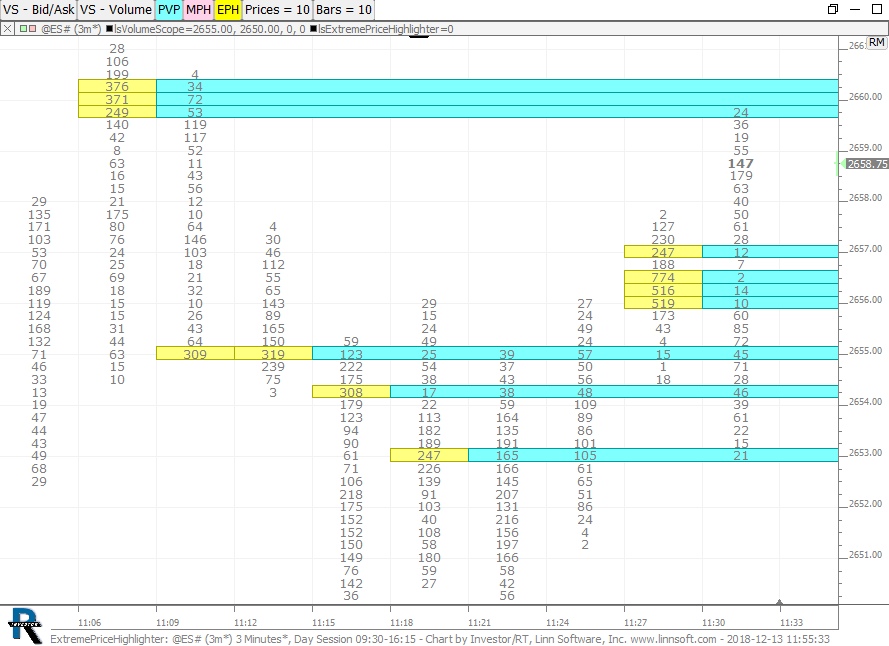 |
ExtremePriceHighlighter (@ES#) cpayne [totalcount]
7 years 7 months ago
ExtremPriceHighlighter. This chart was uploaded by Investor/RT 13.5.12 showing symbol: @ES#. |
View |
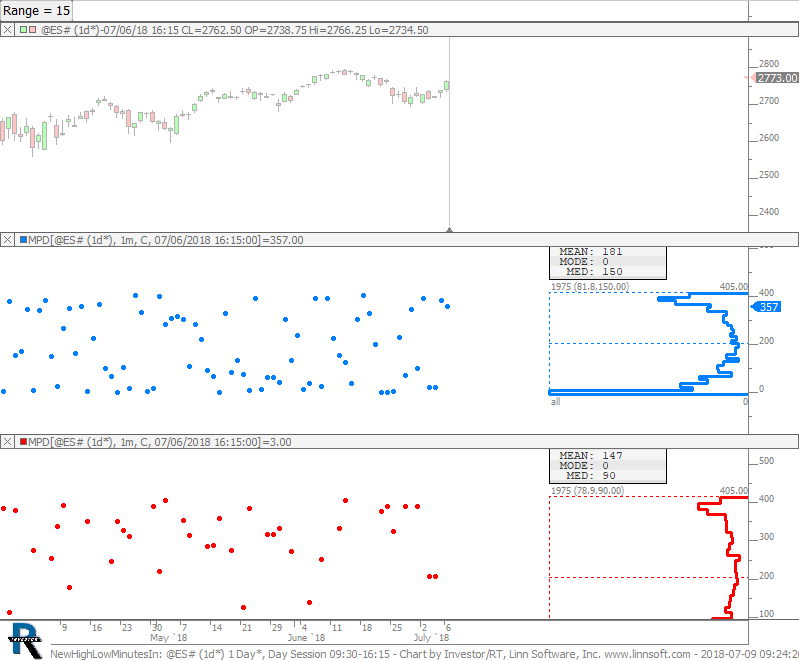 |
NewHighLowMinutesIn (@ES#) cpayne [totalcount]
8 years 6 days ago
Chart plots the time into session that high and low of day was made and then profiles those results to get Mode, Median, and Mean. |
View |
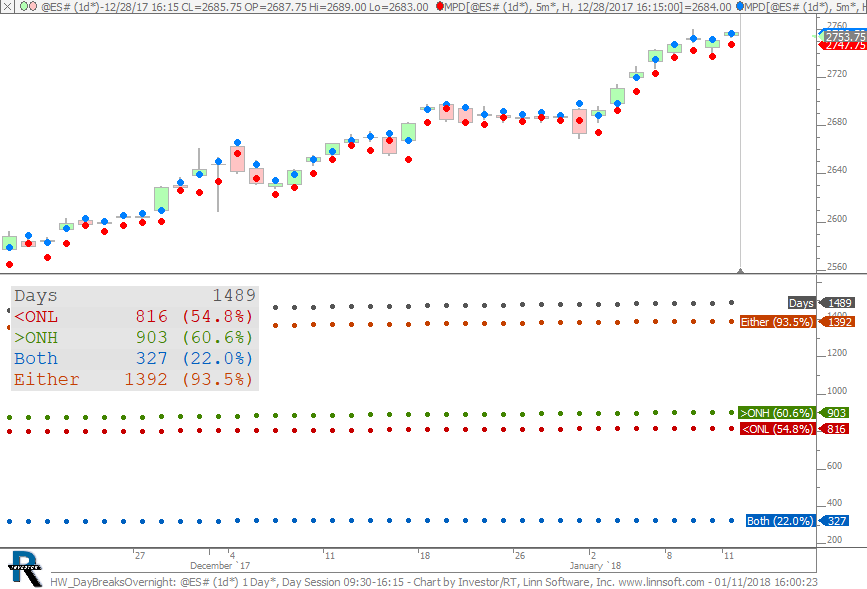 |
HW DayBreaksOvernight (@ES#) cpayne [totalcount]
8 years 6 months ago
How often is overnight high or low broken during day session. |
View |
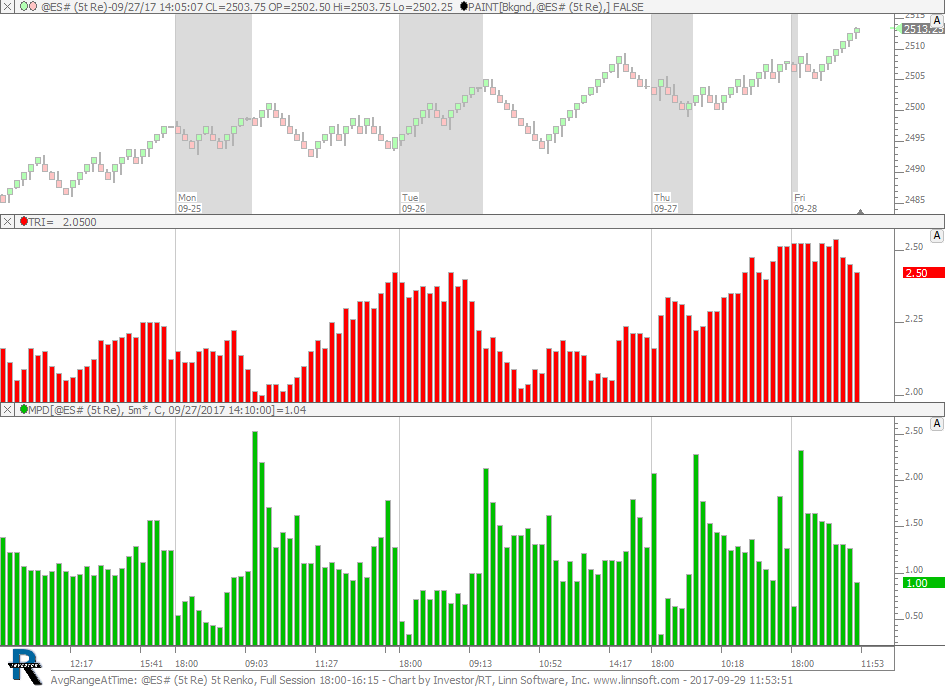 |
AvgRangeAtTime (@ES#) cpayne [totalcount]
8 years 9 months ago
Average Range at Time of Day. This chart is explained in the video Better Volatility. |
View |
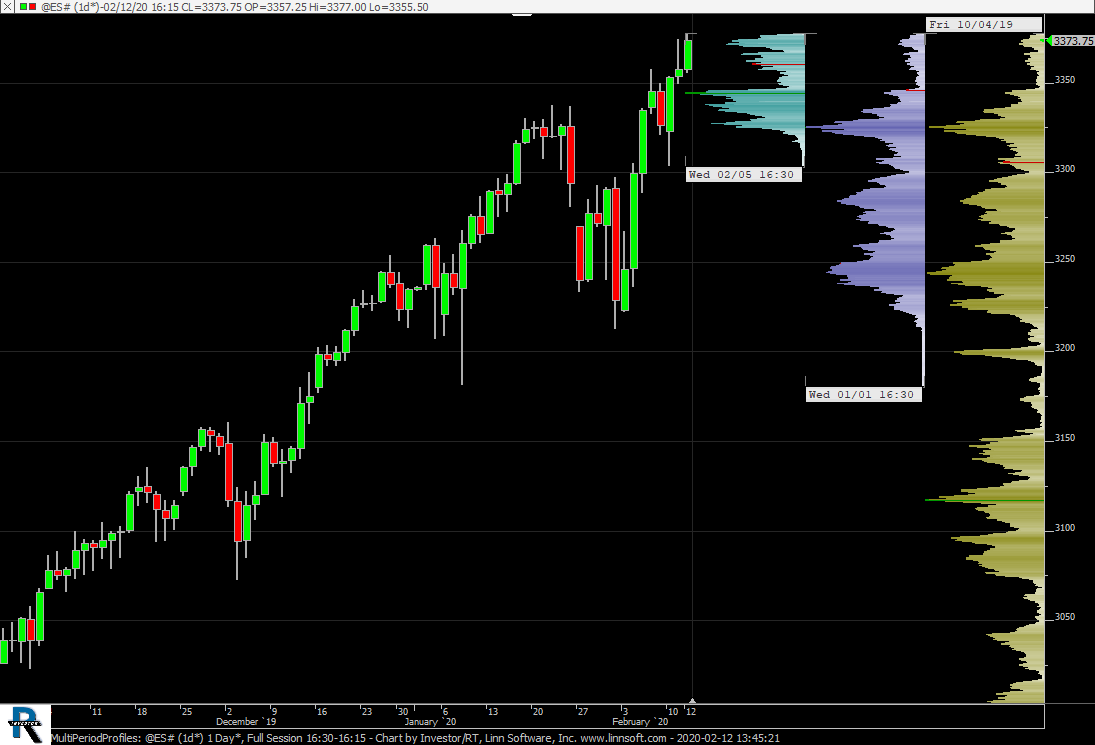 |
MultiPeriodProfiles (@ES#) cpayne [totalcount]
6 years 5 months ago
Multiple Period Overlapping Profiles. This chart is explained in the video Multiple Period Overlapping Profiles. |
View |
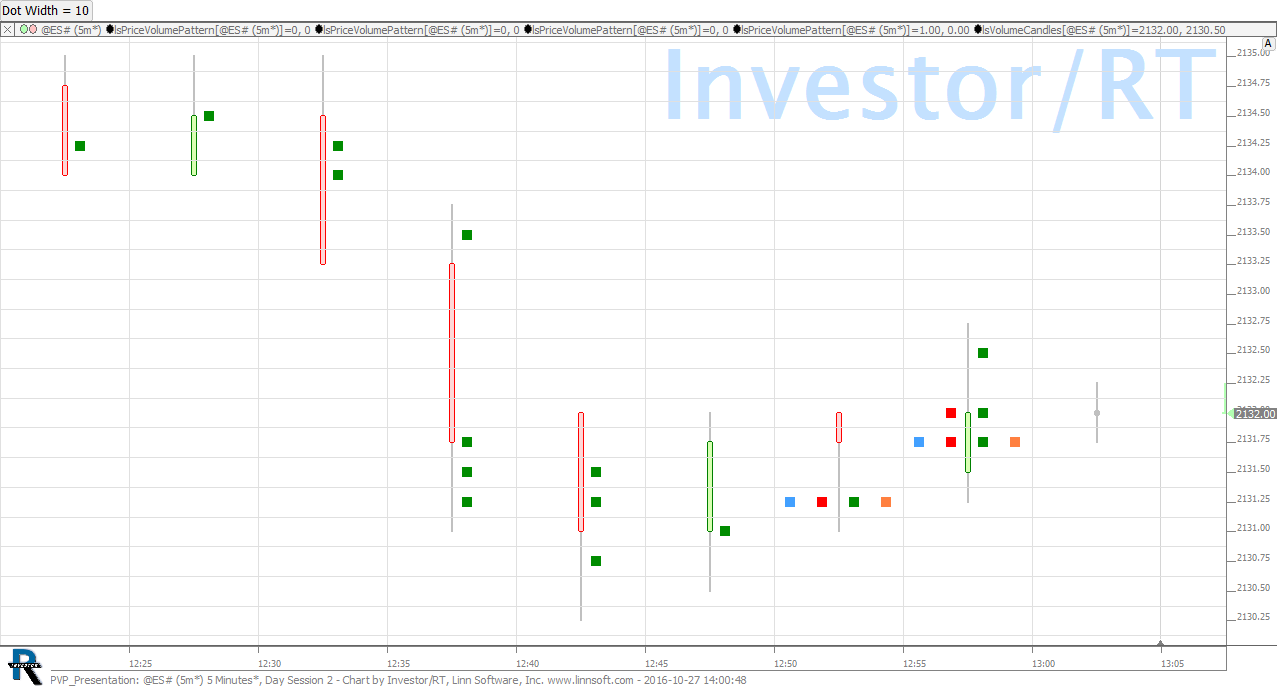 |
PVP Presentation (@ES#) cpayne [totalcount]
9 years 8 months ago
PVP Presenting New Drawing Options. |
View |
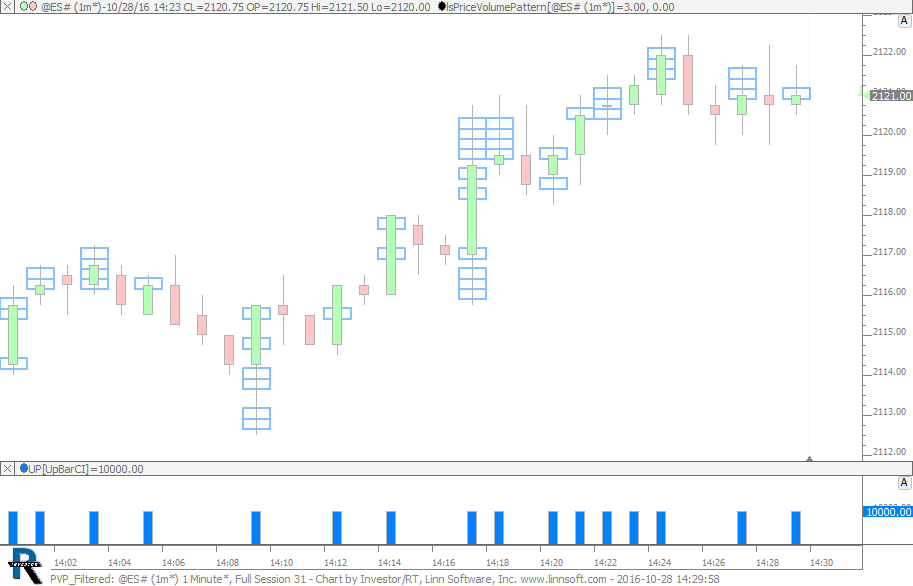 |
PVP Filtered (@ES#) cpayne [totalcount]
9 years 8 months ago
Prive Volume Pattern - Filtering Patterns. This chart is explained in the video Price Volume Pattern - Filtering Patterns. |
View |
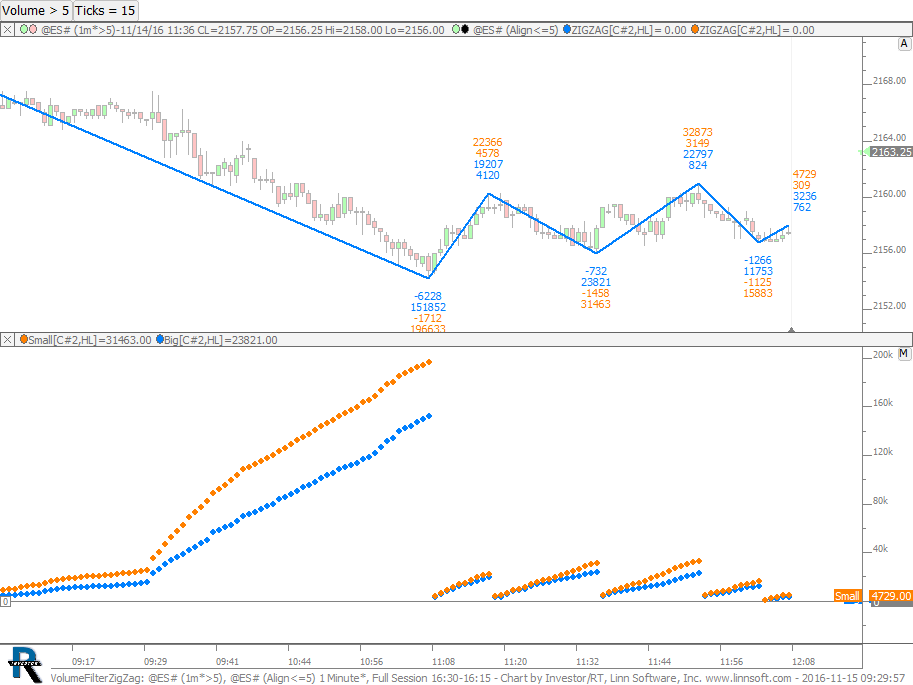 |
VolumeFilterZigZag (@ES#) cpayne [totalcount]
9 years 8 months ago
Volume Filtering with Zig Zag and Zig Zag Oscillator. This chart is explained in the video Volume Filtering: Studying Behavior of Large vs Small Trades. |
View |
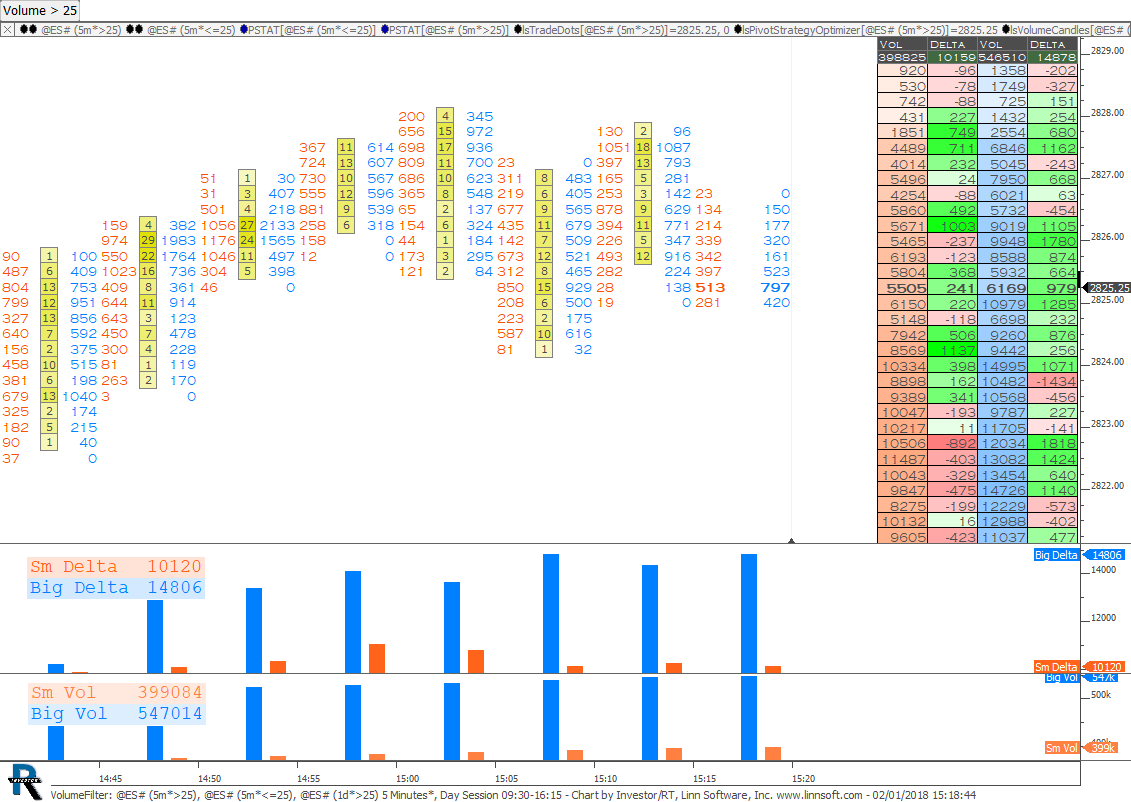 |
VolumeFilter (@ES#) cpayne [totalcount]
8 years 5 months ago
Volume Filtering with Volume Candles, Trade Dots, Profile Indicator, and Volume Breakdown. |
View |
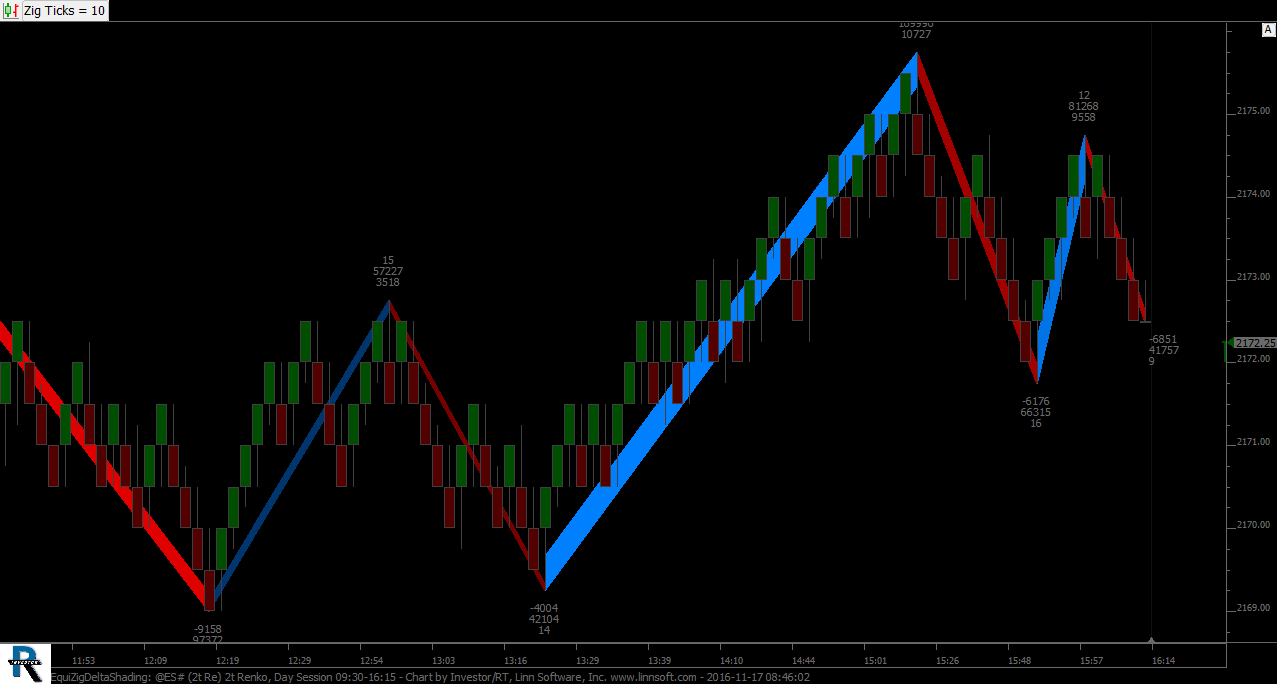 |
EquiZigDeltaShading (@ES#) cpayne [totalcount]
9 years 8 months ago
Equi Zig with Delta Shading. This chart is explained in the video Zig Zag 12.7: Equi-Zig and Delta/Volume Shading. |
View |
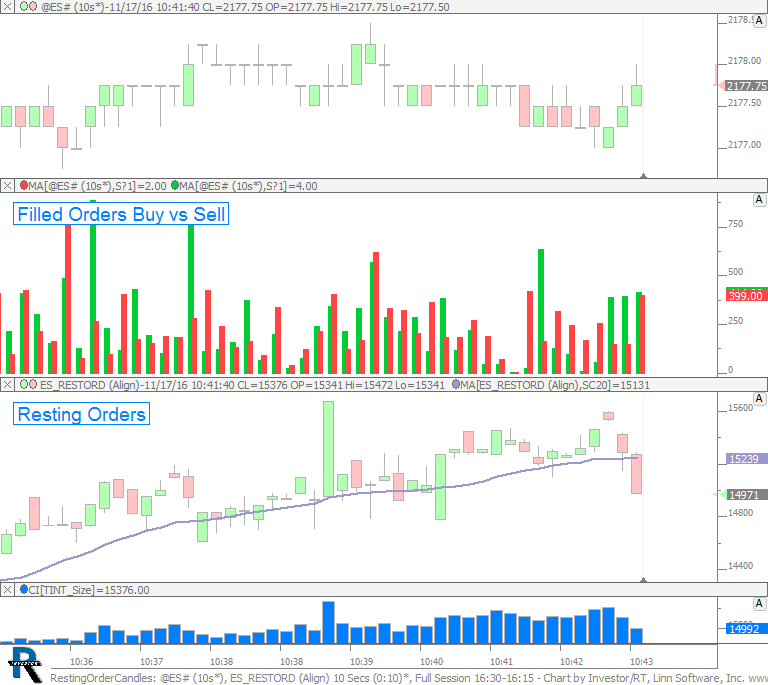 |
RestingOrderCandles (@ES#) cpayne [totalcount]
9 years 8 months ago
Resting Order Candles. This chart is explained in the video Resting Order Candles. |
View |
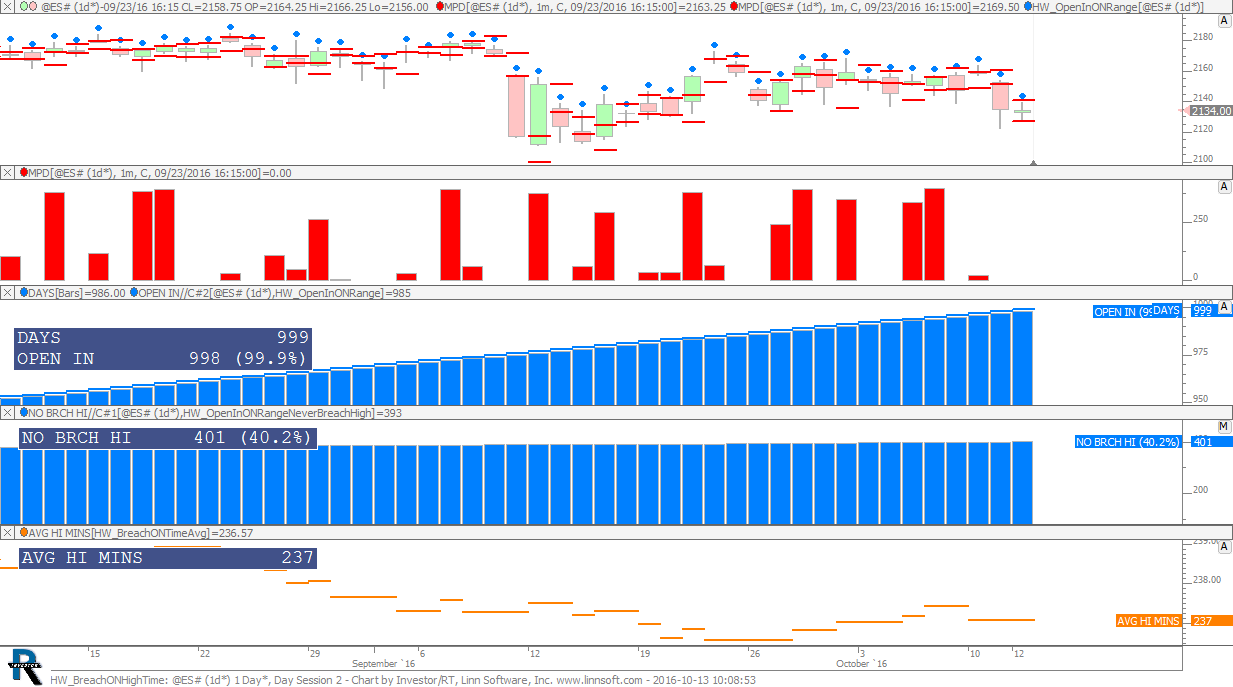 |
HW BreachONHighTime (@ES#) cpayne [totalcount]
9 years 9 months ago
Homework 27: Breached Overnight Session High Time. |
View |
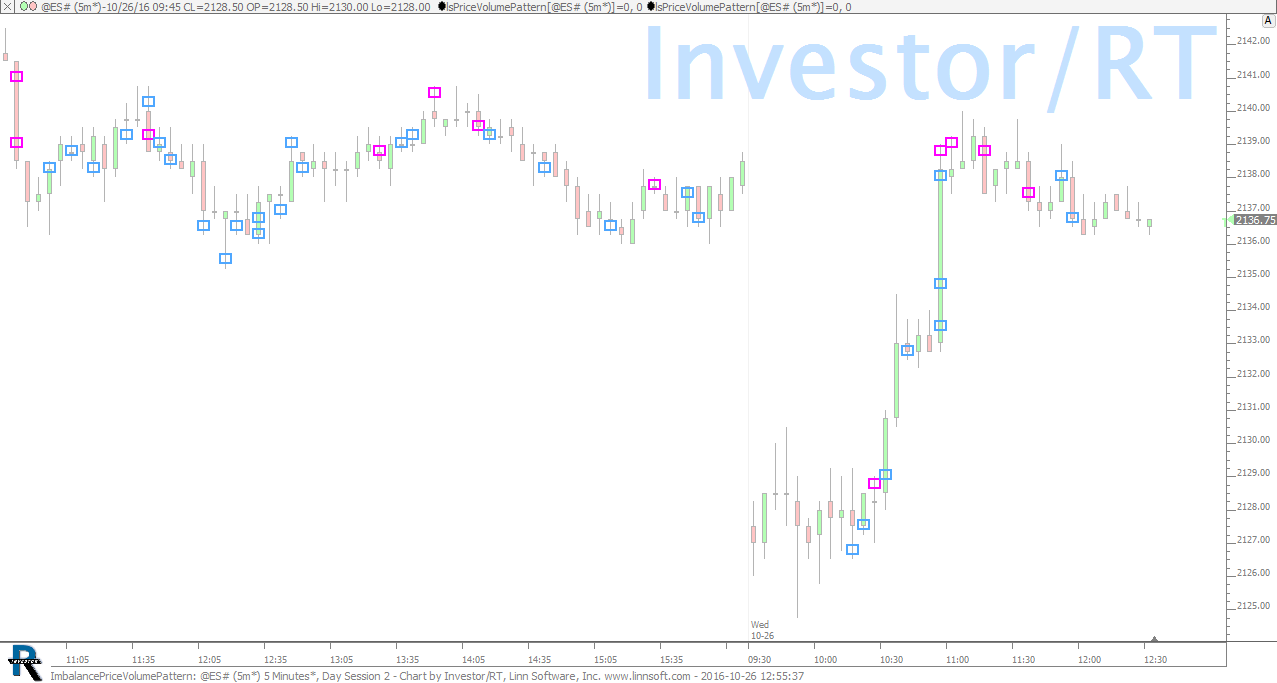 |
ImbalancePriceVolumePattern (@ES#) cpayne [totalcount]
9 years 8 months ago
Identifying Buying and Selling Volume Imbalance Using the Price Volume Pattern (PVP) RTX Indicator. |
View |
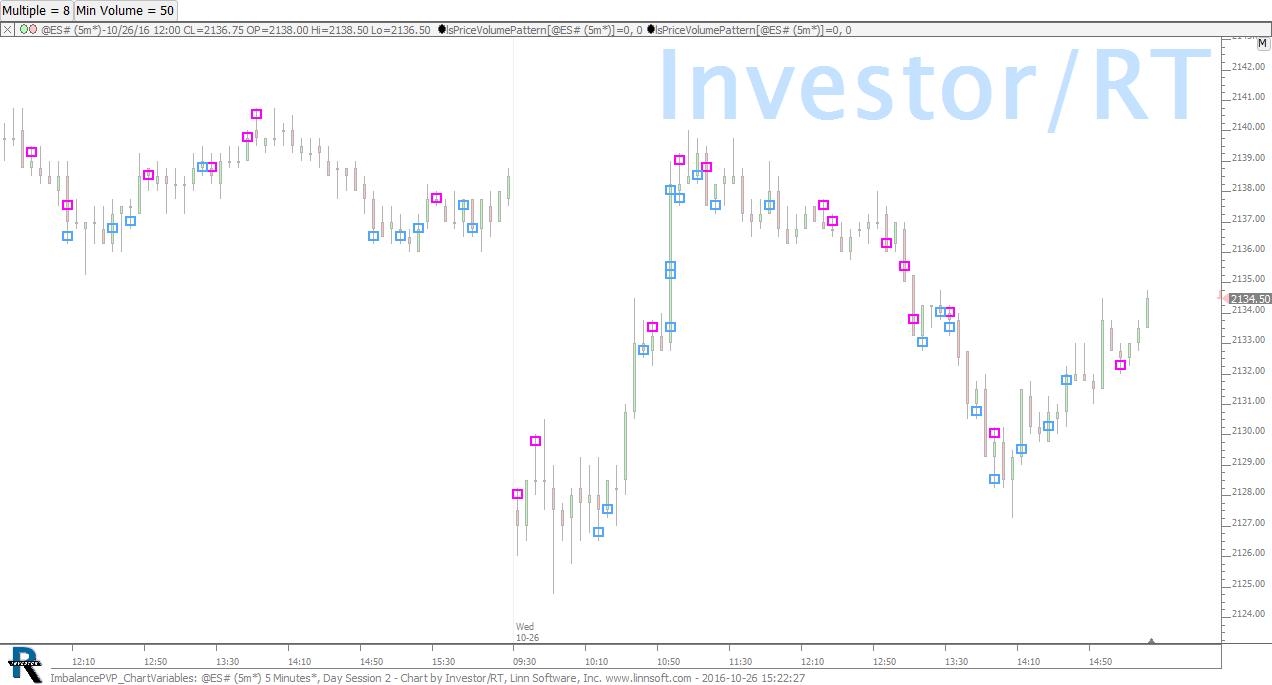 |
ImbalancePVP ChartVariables (@ES#) cpayne [totalcount]
9 years 8 months ago
Identifying Buying and Selling Volume Imbalance Using the Price Volume Pattern (PVP) RTX Indicator - And Using Chart Variables. |
View |
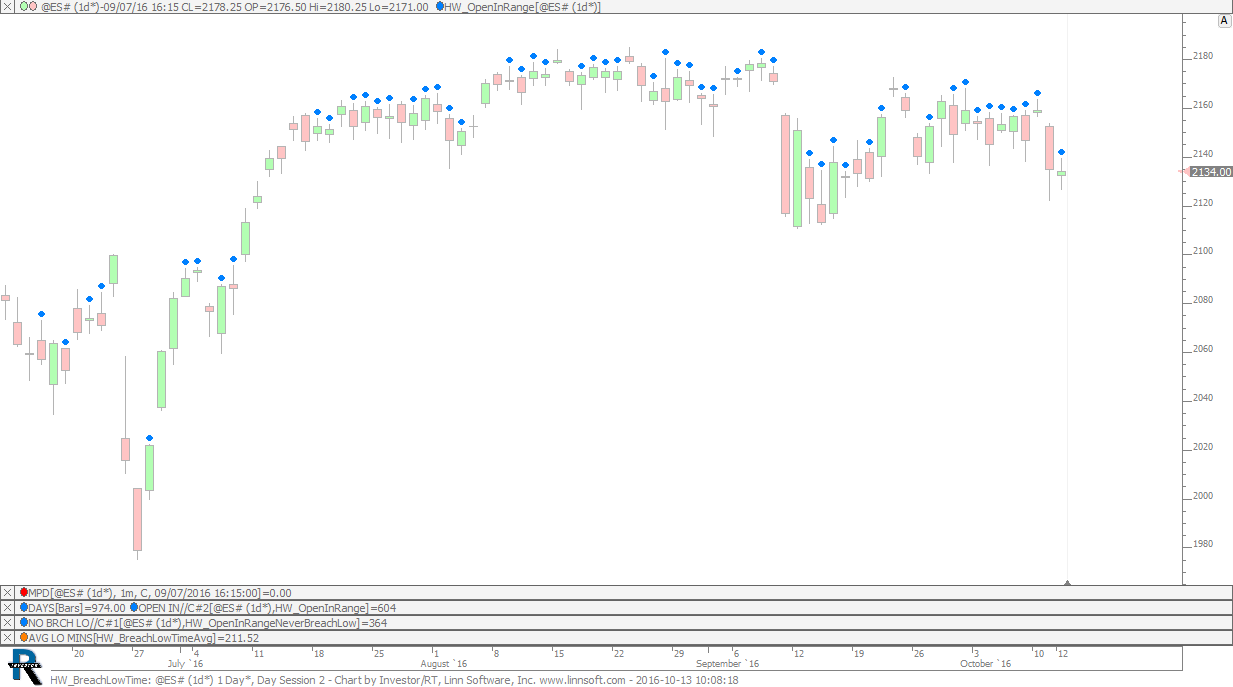 |
HW BreachLowTime (@ES#) cpayne [totalcount]
9 years 9 months ago
Homework 27: Breached Day Session Low Time. |
View |
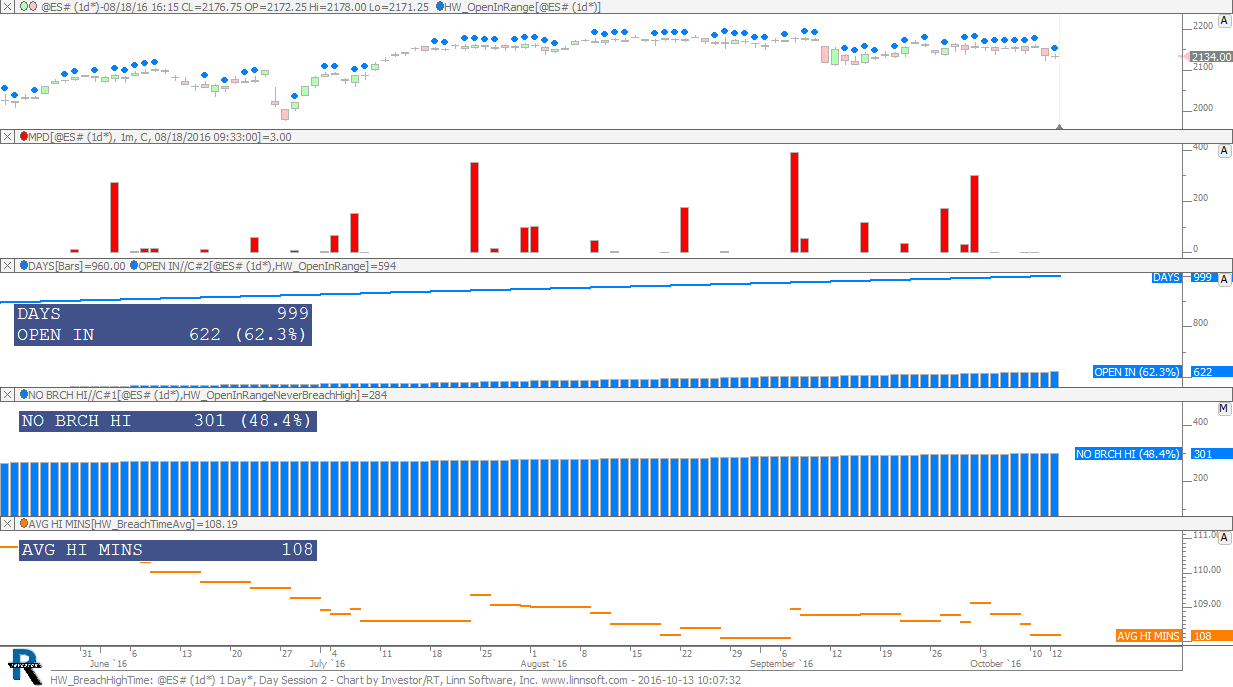 |
HW BreachHighTime (@ES#) cpayne [totalcount]
9 years 9 months ago
Homework 27: Breached Day Session High Time. |
View |
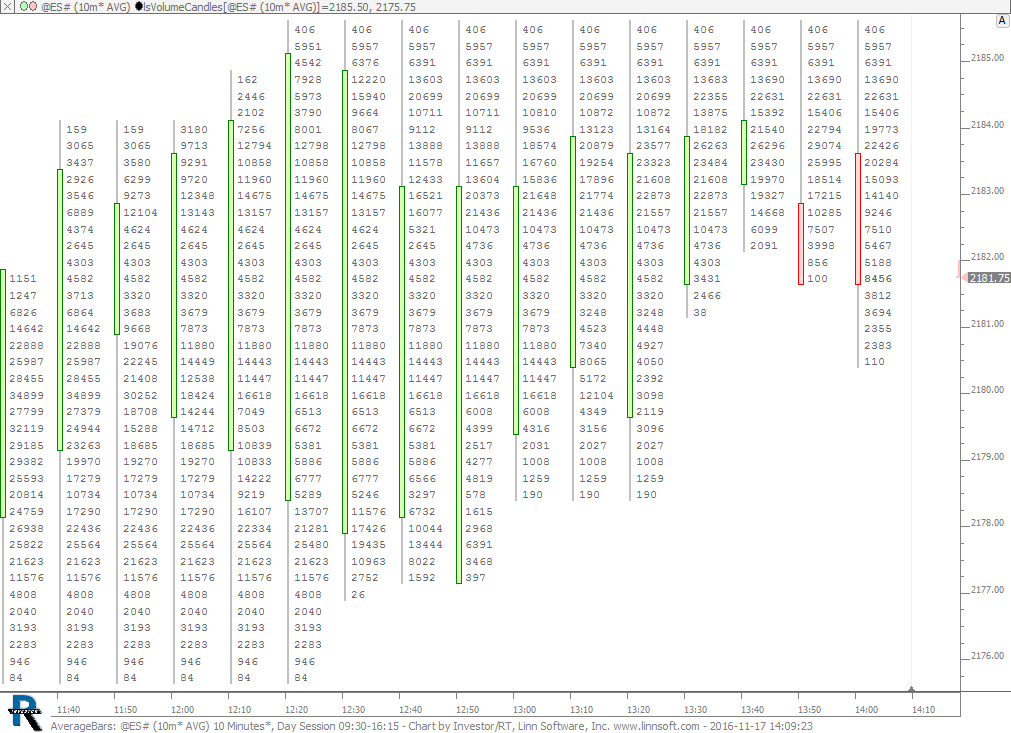 |
AverageBars (@ES#) cpayne [totalcount]
9 years 8 months ago
Average Bars. This chart was uploaded by Investor/RT 12.6.1 showing symbol: @ES#. This chart is explained in the webinar Average Bars. |
View |
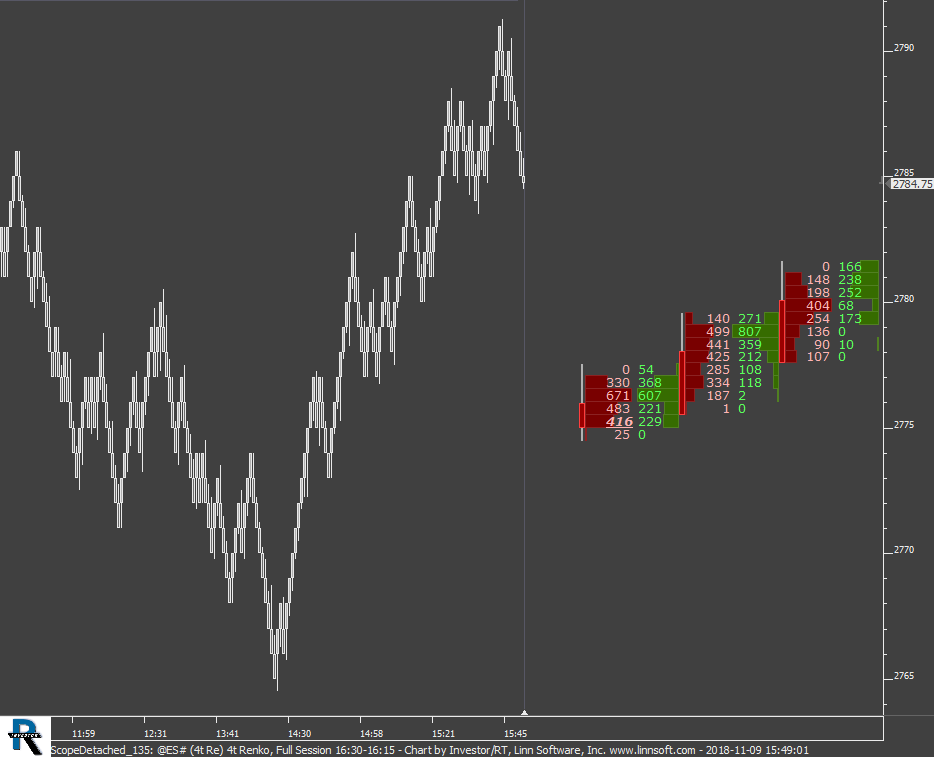 |
ScopeDetached 135 (@ES#) cpayne [totalcount]
7 years 8 months ago
Scope Detached - Investor/RT 13.5 Webinar. This chart was uploaded by Investor/RT 13.5.9 showing symbol: @ES#. |
View |
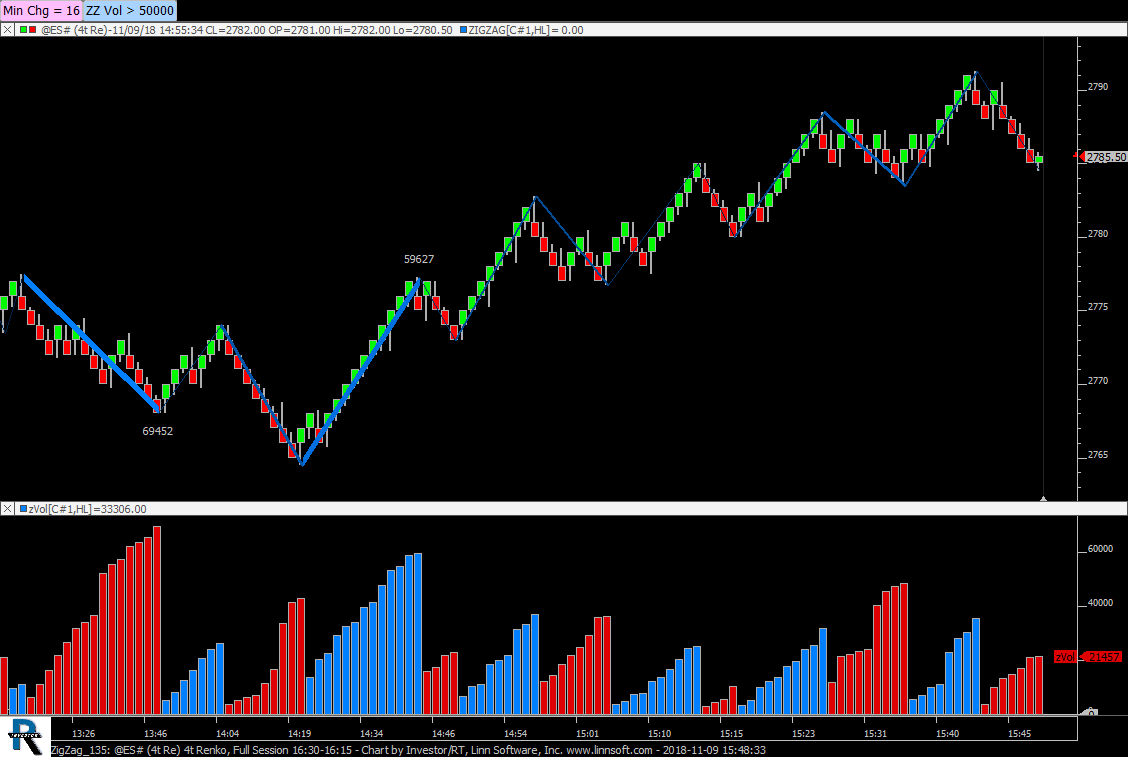 |
ZigZag 135 (@ES#) cpayne [totalcount]
7 years 8 months ago
ZigZag - Investor/RT 13.5 Webinar. This chart was uploaded by Investor/RT 13.5.9 showing symbol: @ES#. |
View |
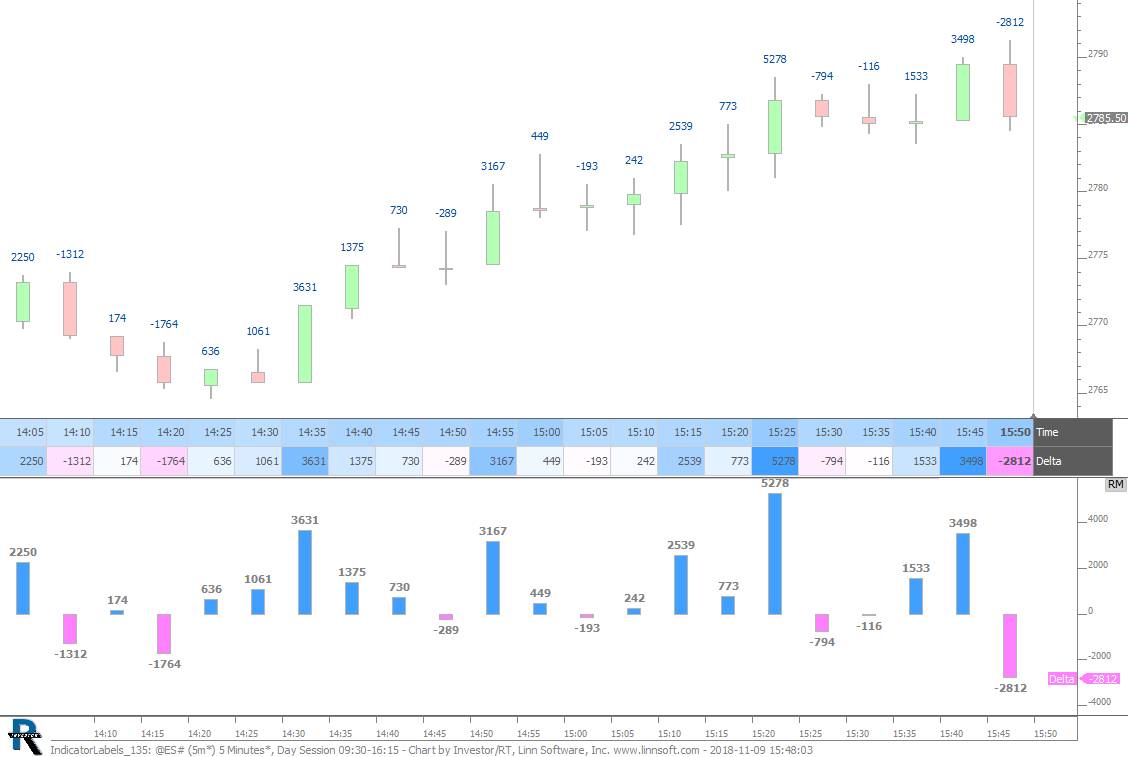 |
IndicatorLabels 135 (@ES#) cpayne [totalcount]
7 years 8 months ago
IndicatorLabels - Investor/RT 13.5 Webinar. This chart was uploaded by Investor/RT 13.5.9 showing symbol: @ES#. |
View |
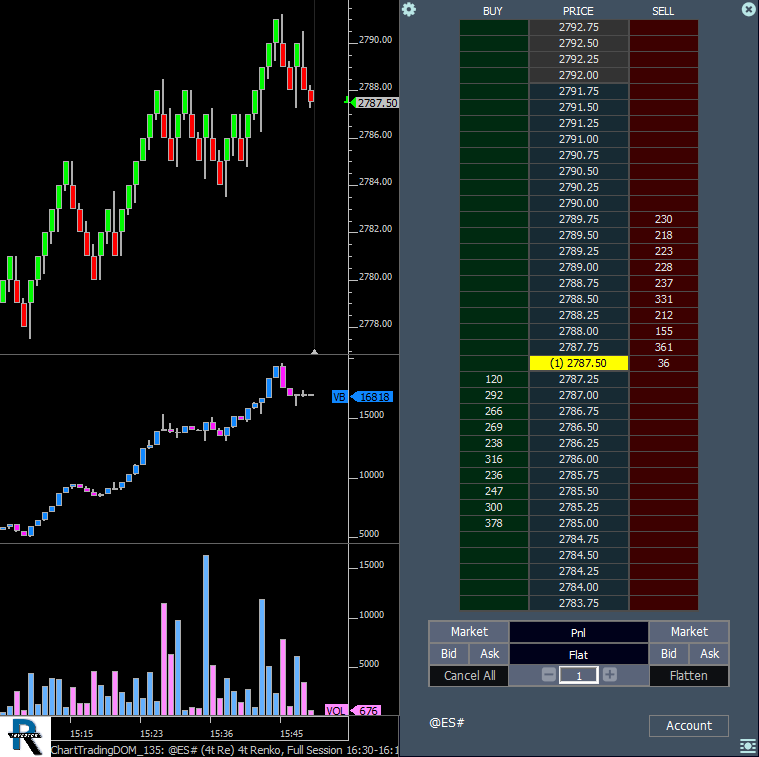 |
ChartTradingDOM 135 (@ES#) cpayne [totalcount]
7 years 8 months ago
ChartTradingDOM - Invesor/RT 13.5 Webinar. This chart was uploaded by Investor/RT 13.5.9 showing symbol: @ES#. |
View |