 |
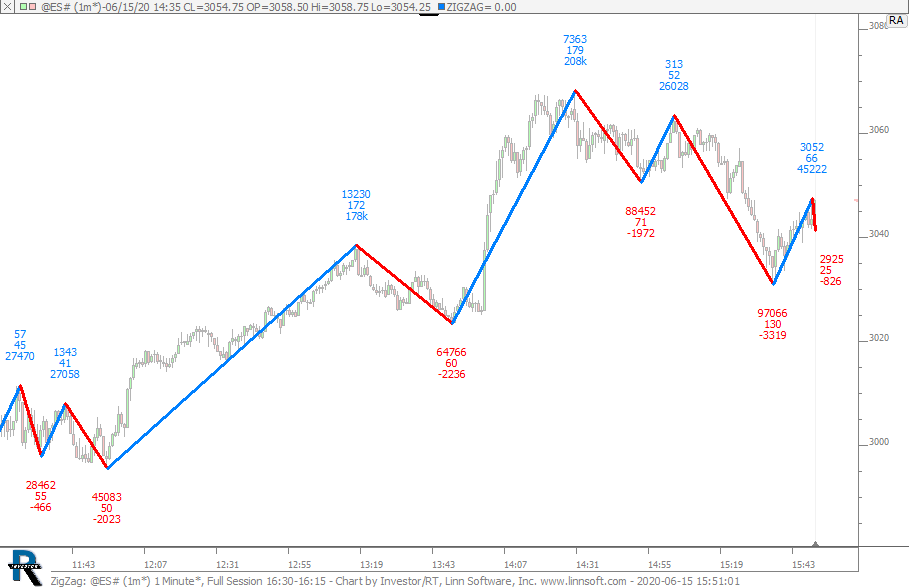
ZigZag (@ES#) cpayne [totalcount]
6 years 4 weeks ago
Zig Zag Indicator. This chart was uploaded by Investor/RT 14.1.12 showing symbol: @ES#. |
View |
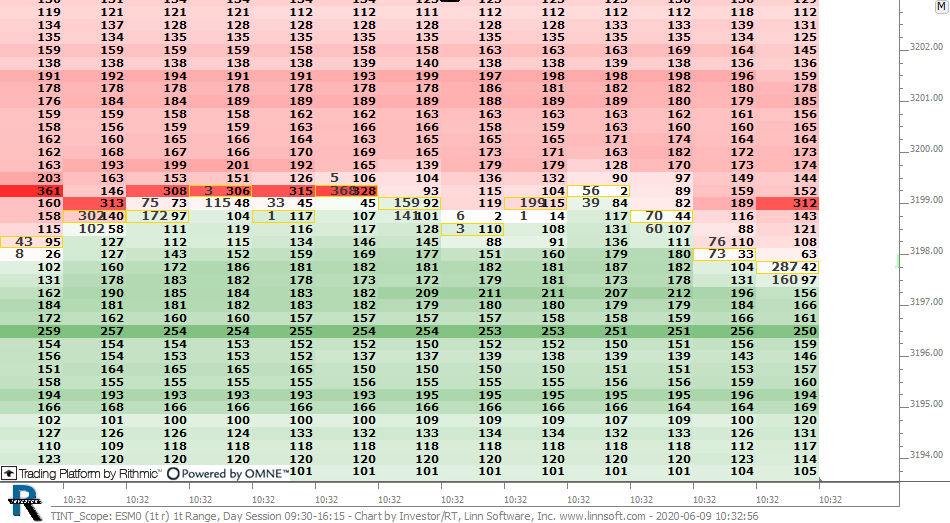 |
TINT Scope (ESM0) cpayne [totalcount]
6 years 1 month ago
VolumeScope with TINT on 1t Range Bar. This chart was uploaded by Investor/RT 14.1.11 showing symbol: ESM0. |
View |
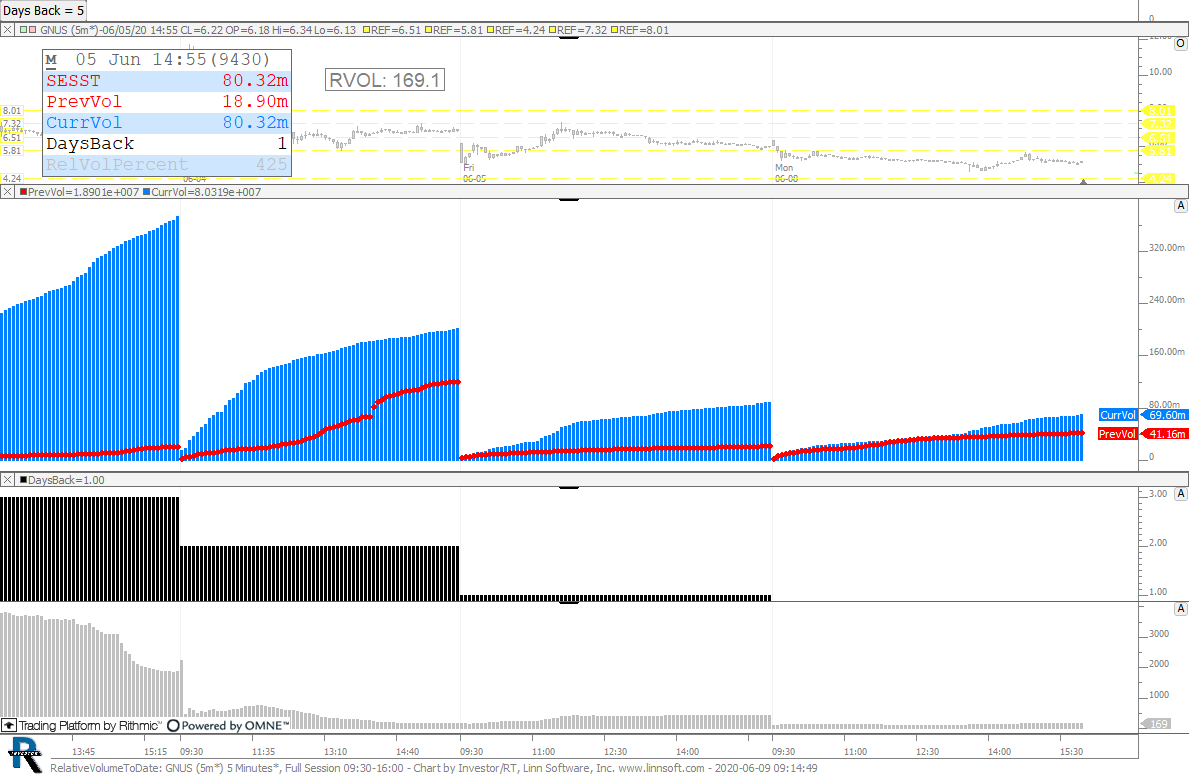 |
RelativeVolumeToDate (GNUS) 2 cpayne [totalcount]
6 years 1 month ago
This chart was uploaded by Investor/RT 14.1.11 showing symbol: GNUS. |
View |
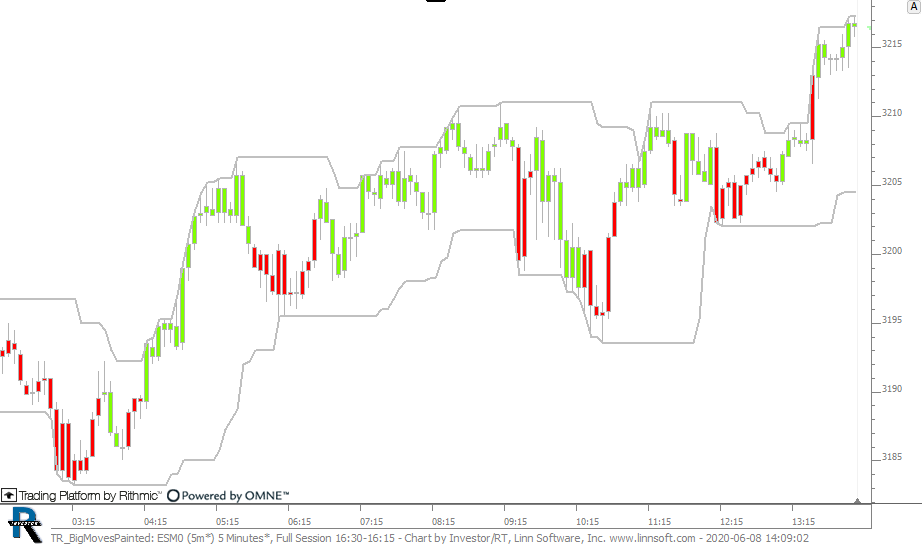 |
TR BigMovesPainted (ESM0) cpayne [totalcount]
6 years 1 month ago
Painting Big True Range Moves. This chart was uploaded by Investor/RT 14.1.11 showing symbol: ESM0. |
View |
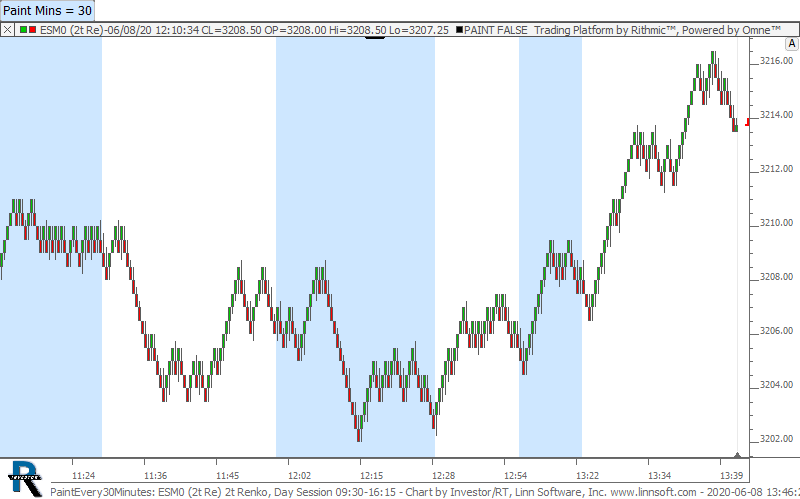 |
PaintEvery30Minutes (ESM0) cpayne [totalcount]
6 years 1 month ago
Paint Every 30 Minutes on 2t Renko Chart. This chart was uploaded by Investor/RT 14.1.11 showing symbol: ESM0. |
View |
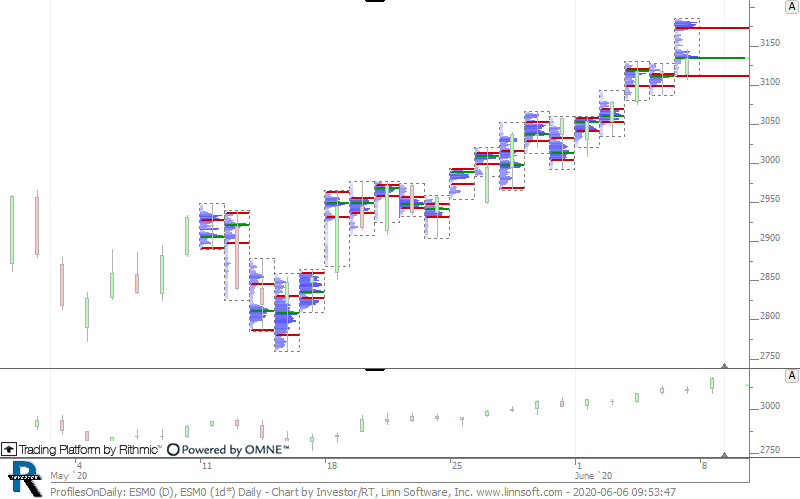 |
ProfilesOnDaily (ESM0) cpayne [totalcount]
6 years 1 month ago
Profiles on Daily Bars. This chart was uploaded by Investor/RT 14.1.11 showing symbol: ESM0. |
View |
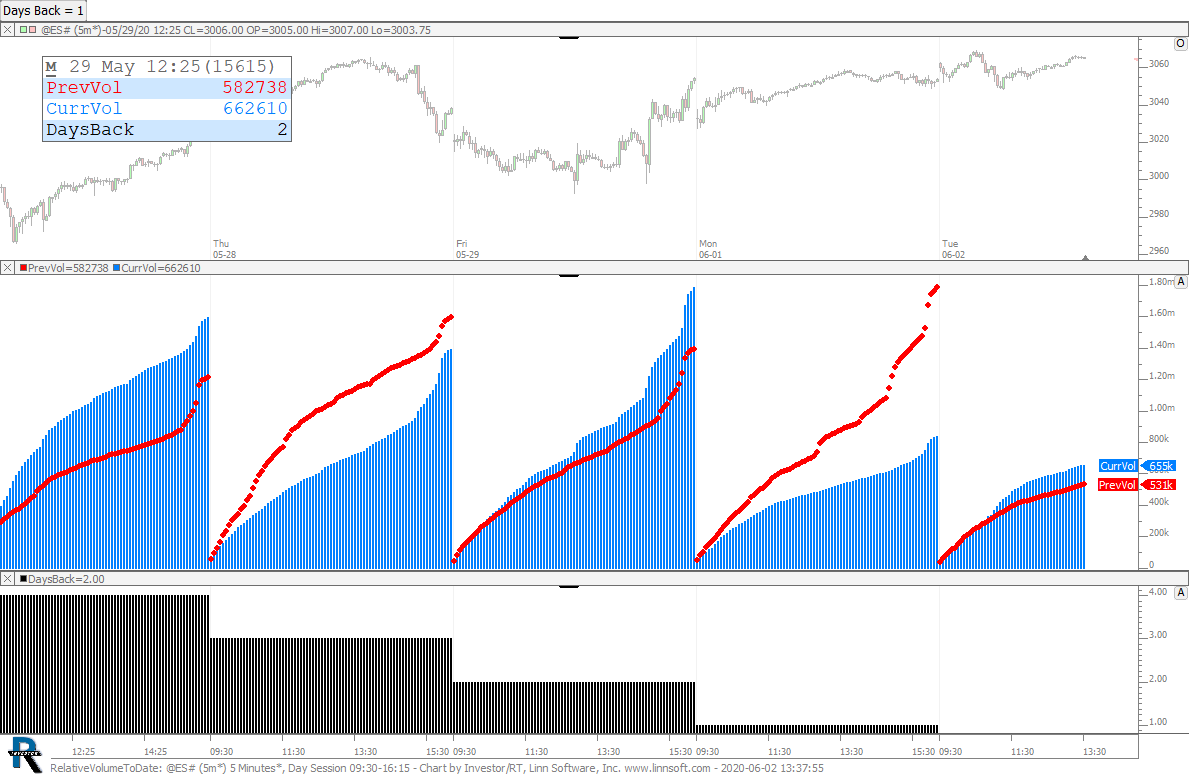 |
RelativeVolumeToDate (@ES#) cpayne [totalcount]
6 years 1 month ago
Relative Volume to Prior Date. This chart was uploaded by Investor/RT 14.1.11 showing symbol: @ES#. |
View |
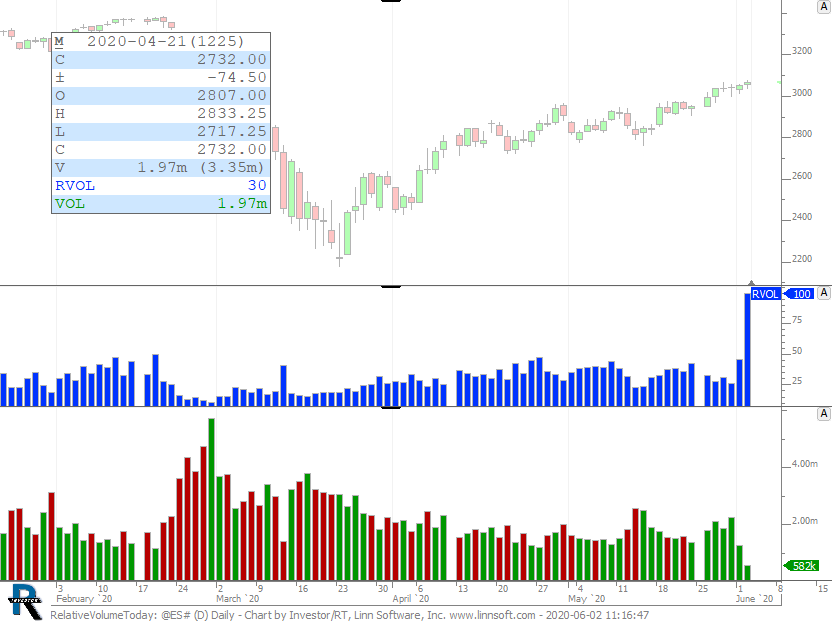 |
RelativeVolumeToday (@ES#) cpayne [totalcount]
6 years 1 month ago
Relative Volume to Today. This chart was uploaded by Investor/RT 14.1.10 showing symbol: @ES#. |
View |
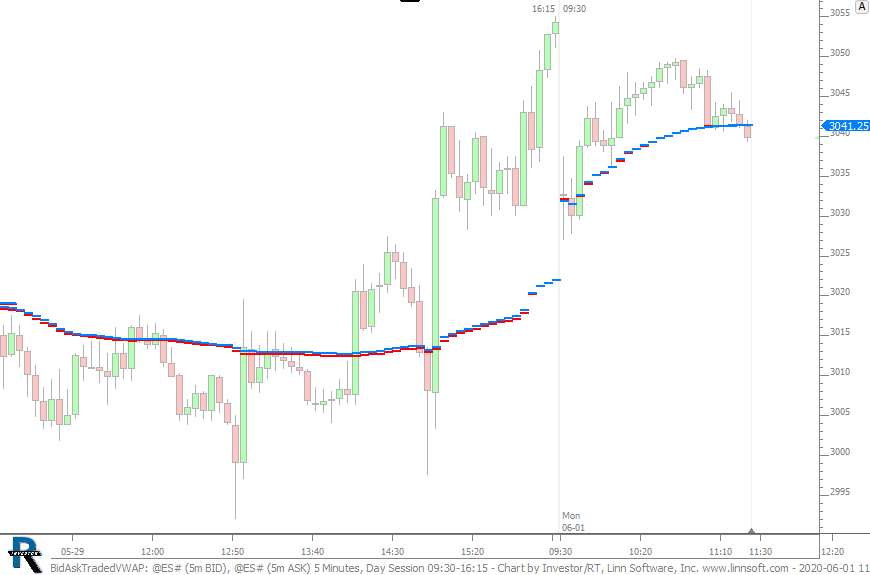 |
BidAskTradedVWAP (@ES#) cpayne [totalcount]
6 years 1 month ago
Bid vs Ask Traded VWAP (Blue is Ask Traded VWAP). This chart was uploaded by Investor/RT 14.1.10 showing symbol: @ES#. |
View |
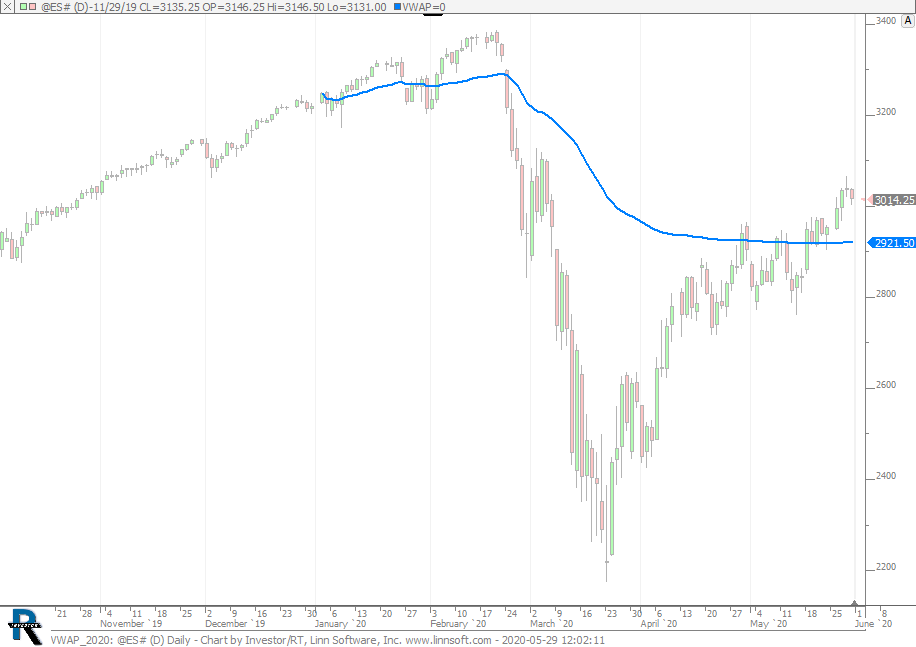 |
VWAP 2020 (@ES#) cpayne [totalcount]
6 years 1 month ago
Cumulative VWAP for 2020. This chart was uploaded by Investor/RT 14.1.10 showing symbol: @ES#. |
View |
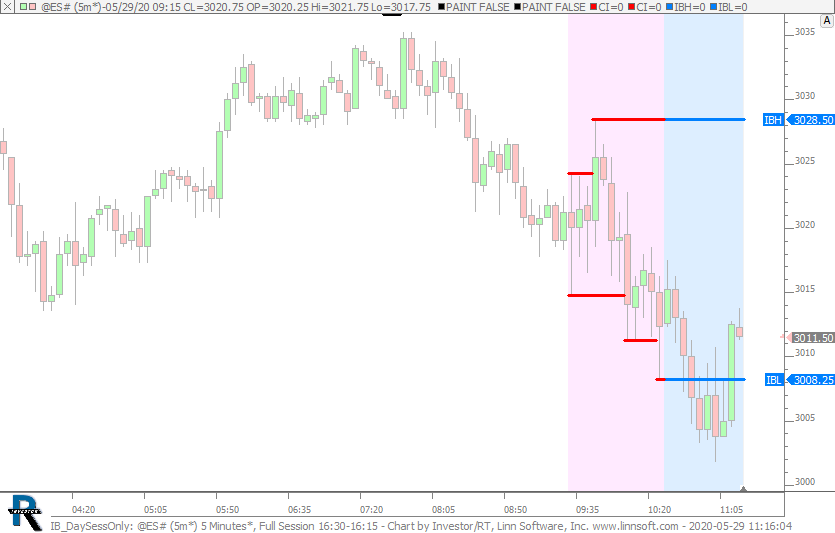 |
IB DaySessOnly (@ES#) cpayne [totalcount]
6 years 1 month ago
Day Session Initial Balance only shows during day session with different color during IB period. This chart was uploaded by Investor/RT 14.1.10 showing symbol: @ES#. |
View |
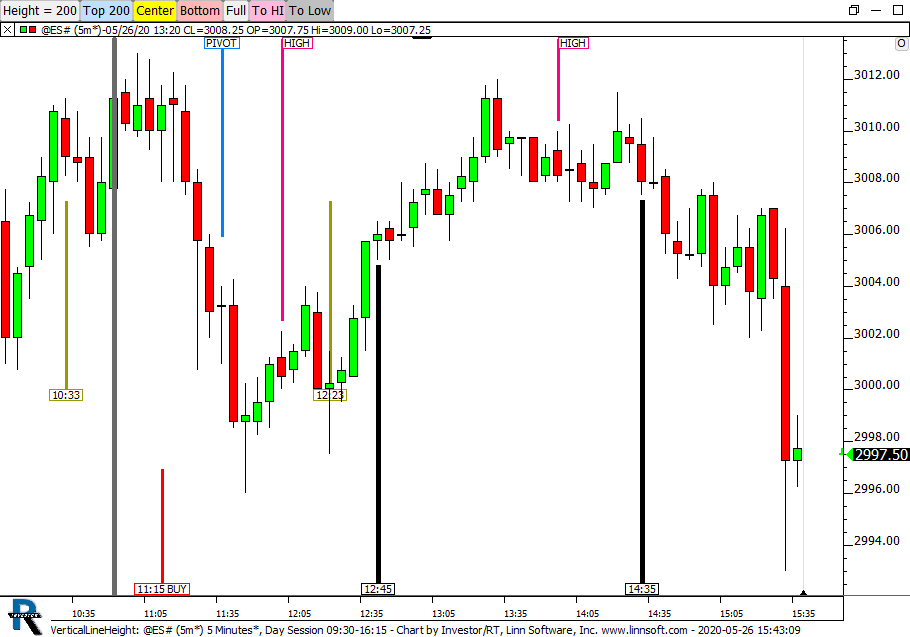 |
VerticalLineHeight (@ES#) cpayne [totalcount]
6 years 1 month ago
Vertical Reference Lines. This chart was uploaded by Investor/RT 14.1.10 showing symbol: @ES#. |
View |
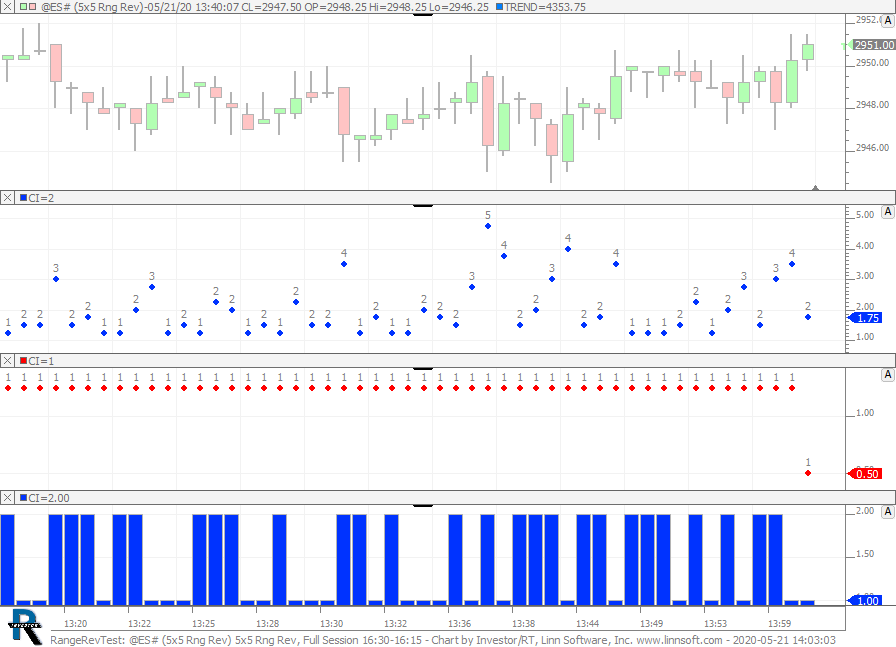 |
RangeRevTest (@ES#) cpayne [totalcount]
6 years 1 month ago
Range and Reversal Test Chart. This chart was uploaded by Investor/RT 14.1.10 showing symbol: @ES#. |
View |
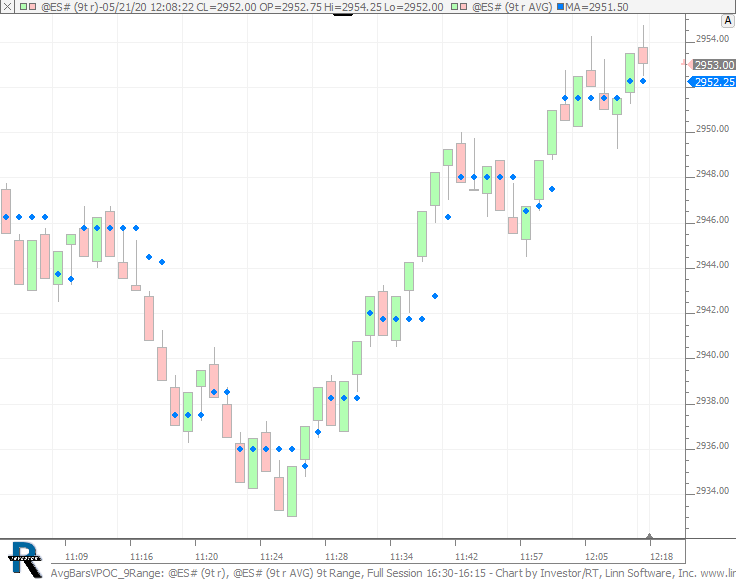 |
AvgBarsVPOC 9Range (@ES#) cpayne [totalcount]
6 years 1 month ago
VPOC - 5 Bar using Average Bars (Layered) - Leaving Original Periodicity. This chart was uploaded by Investor/RT 14.1.10 showing symbol: @ES#. |
View |
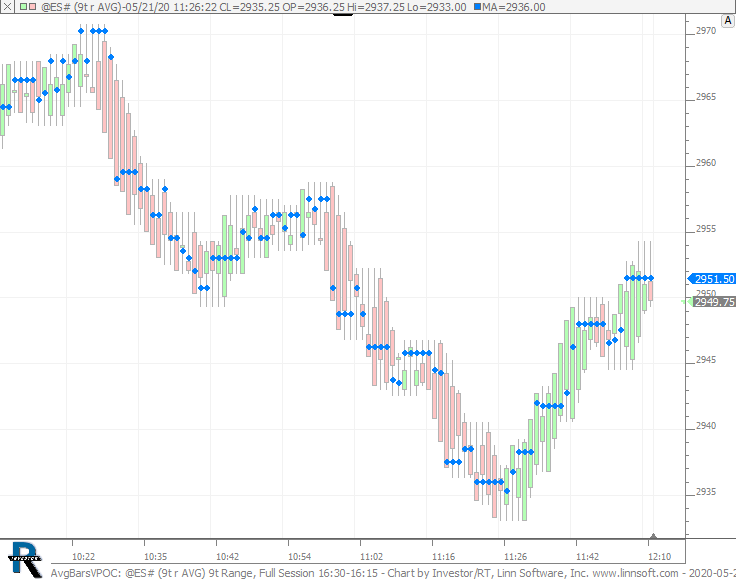 |
AvgBarsVPOC (@ES#) cpayne [totalcount]
6 years 1 month ago
VPOC - 5 Bar using Average Bars (Layered). This chart was uploaded by Investor/RT 14.1.10 showing symbol: @ES#. |
View |
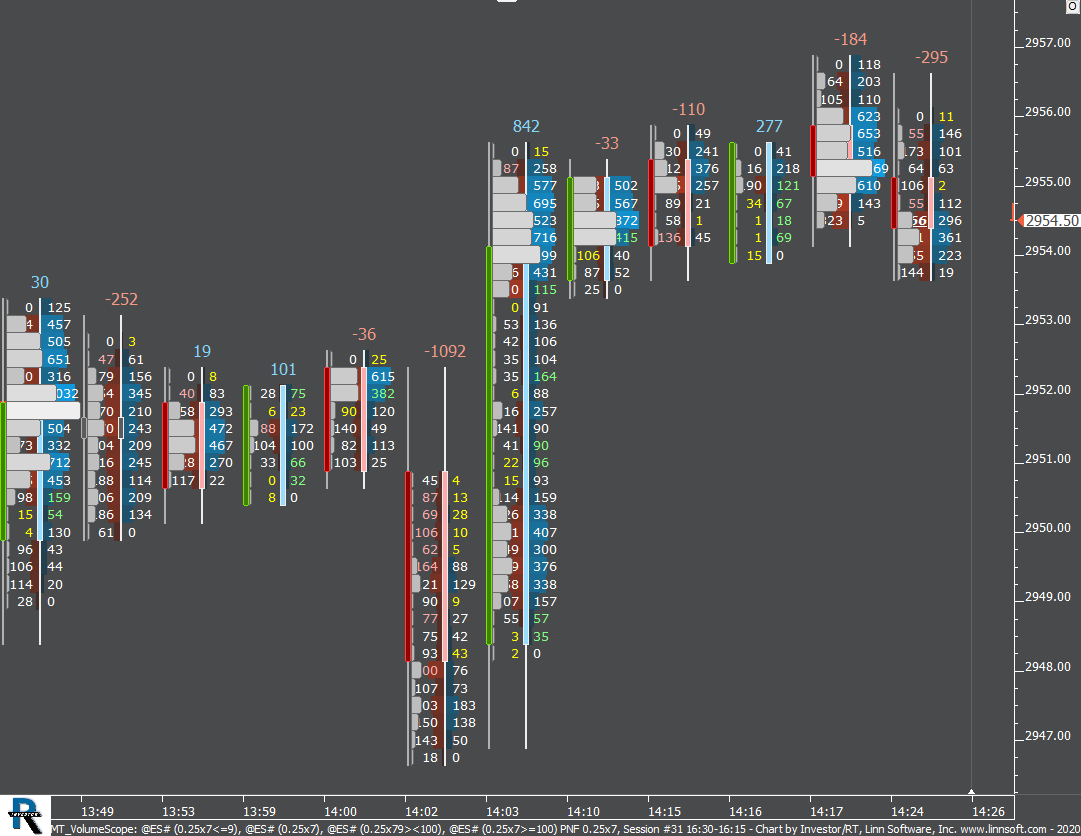 |
MT VolumeScope (@ES#) cpayne [totalcount]
6 years 1 month ago
This chart was uploaded by Investor/RT 14.1.10 showing symbol: @ES#. |
View |
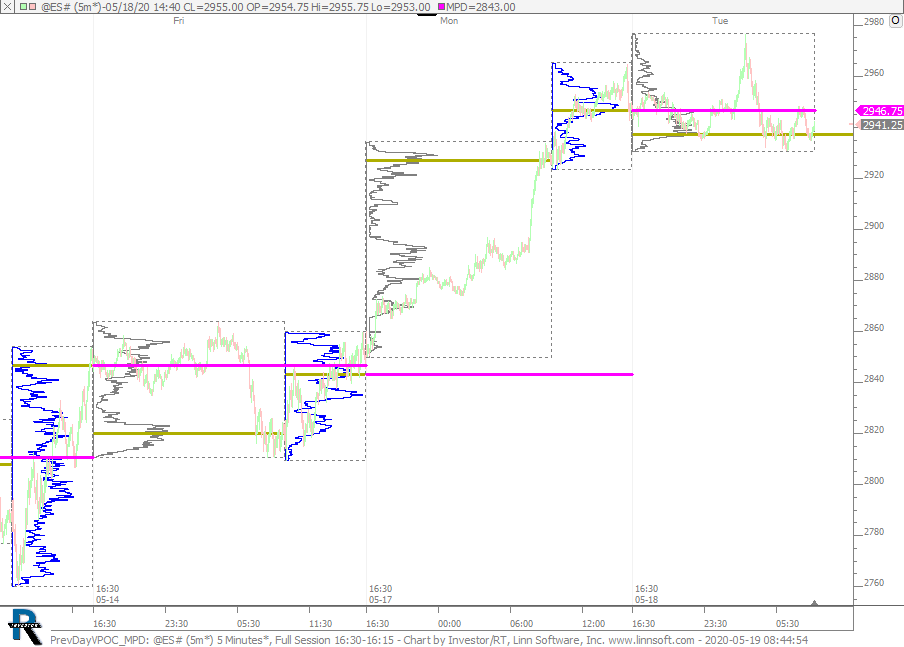 |
PrevDayVPOC MPD (@ES#) cpayne [totalcount]
6 years 1 month ago
Previous Day VPOC via MPD, PROF, and SESST. This chart was uploaded by Investor/RT 14.1.9 showing symbol: @ES#. |
View |
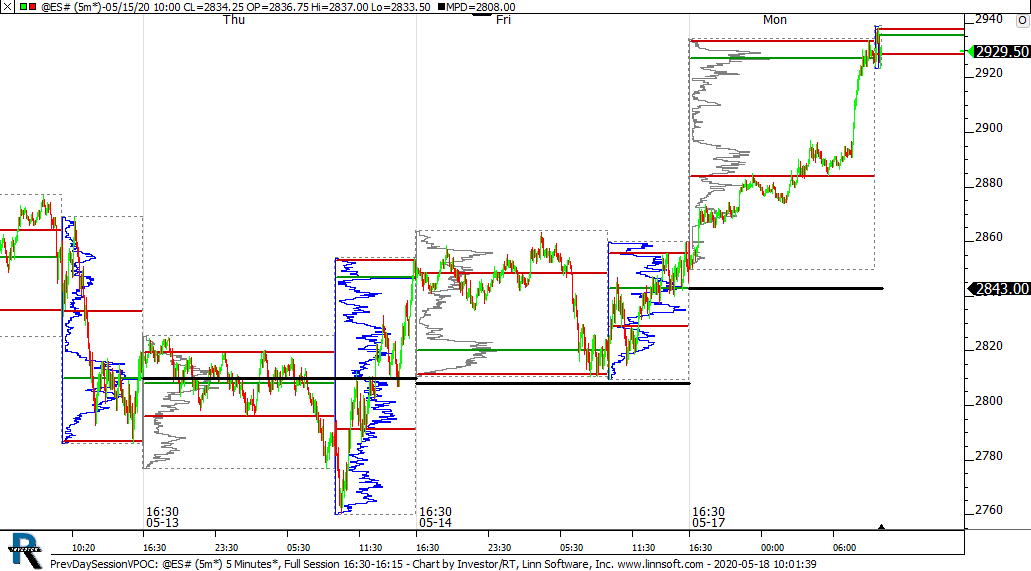 |
PrevDaySessionVPOC (@ES#) cpayne [totalcount]
6 years 1 month ago
Previous Day VPOC. This chart was uploaded by Investor/RT 14.1.9 showing symbol: @ES#. |
View |
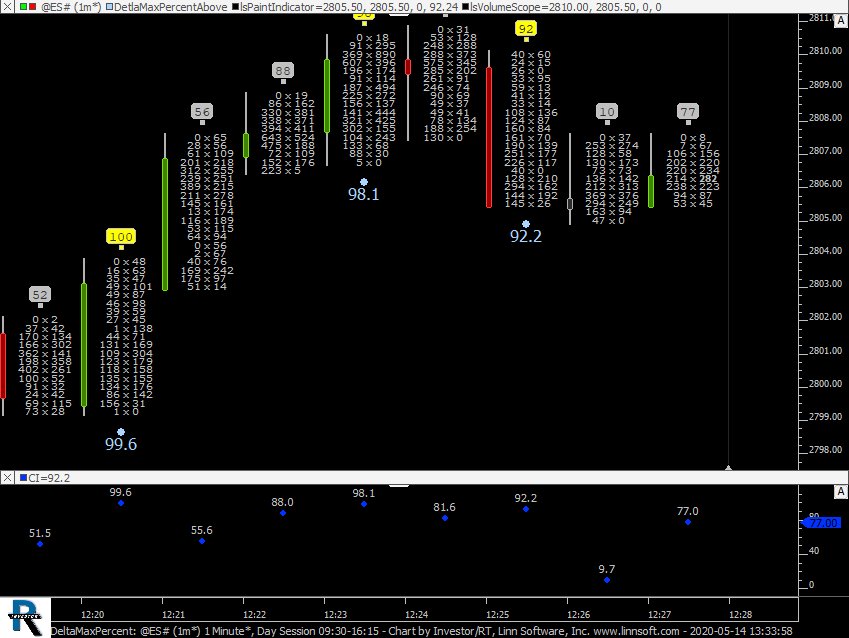 |
DeltaMaxPercent (@ES#) cpayne [totalcount]
6 years 2 months ago
Delta as Percent of Extreme. This chart was uploaded by Investor/RT 14.1.7 showing symbol: @ES#. |
View |
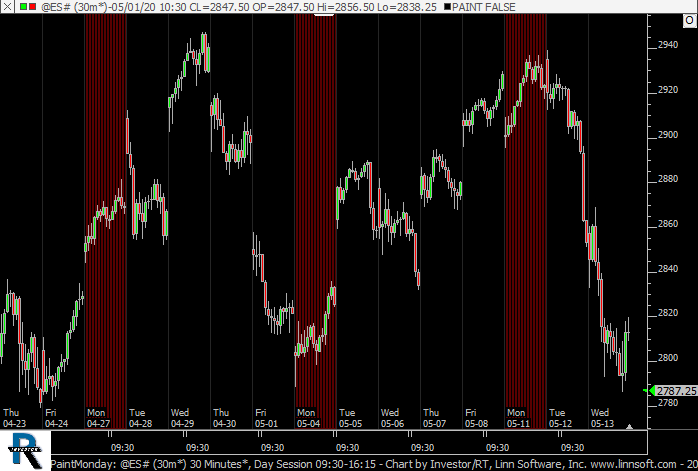 |
PaintMonday (@ES#) cpayne [totalcount]
6 years 2 months ago
Painting Monday. This chart was uploaded by Investor/RT 14.1.7 showing symbol: @ES#. |
View |
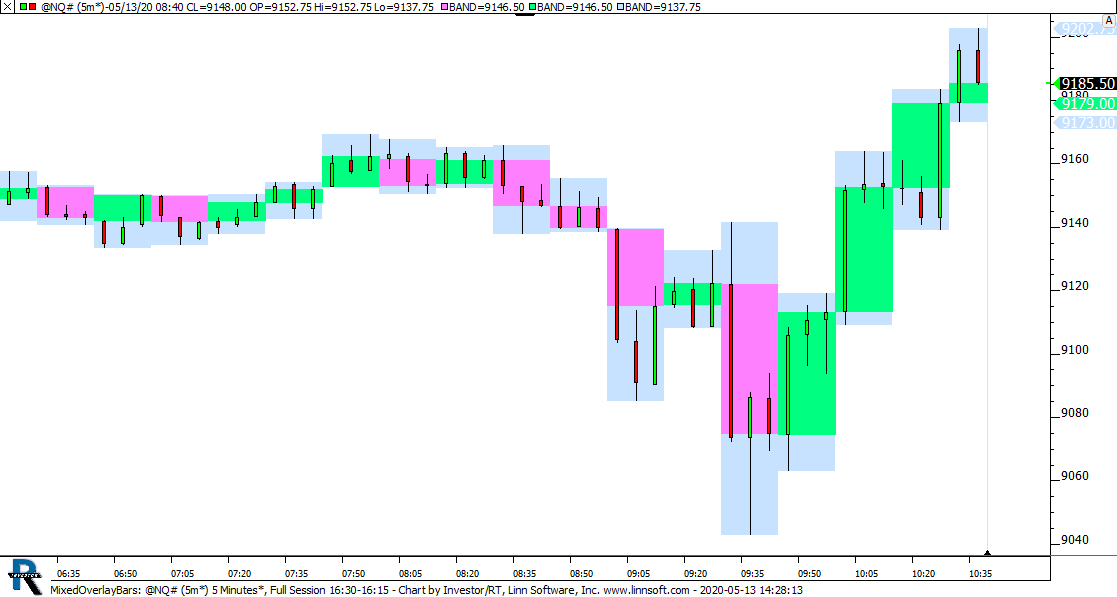 |
MixedOverlayBars (@NQ#) cpayne [totalcount]
6 years 2 months ago
15 Min Candles on 5 Min Candles. This chart was uploaded by Investor/RT 14.1.7 showing symbol: @NQ#. |
View |
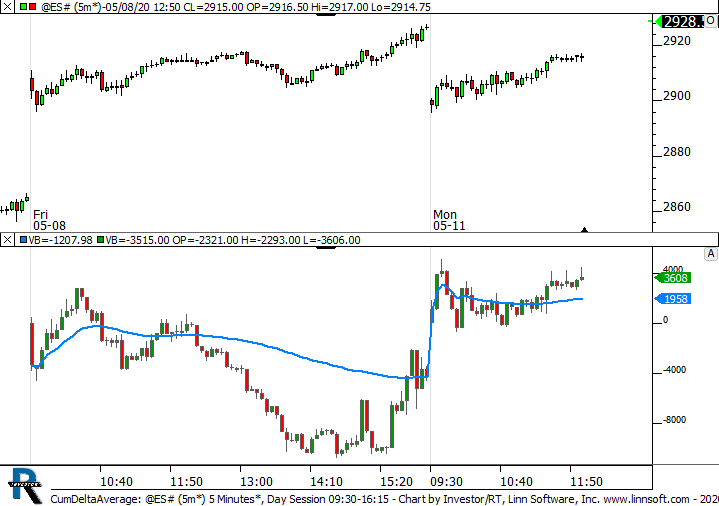 |
CumDeltaAverage (@ES#) cpayne [totalcount]
6 years 2 months ago
Cumulative Detla with Moving Average. This chart was uploaded by Investor/RT 14.1.7 showing symbol: @ES#. |
View |
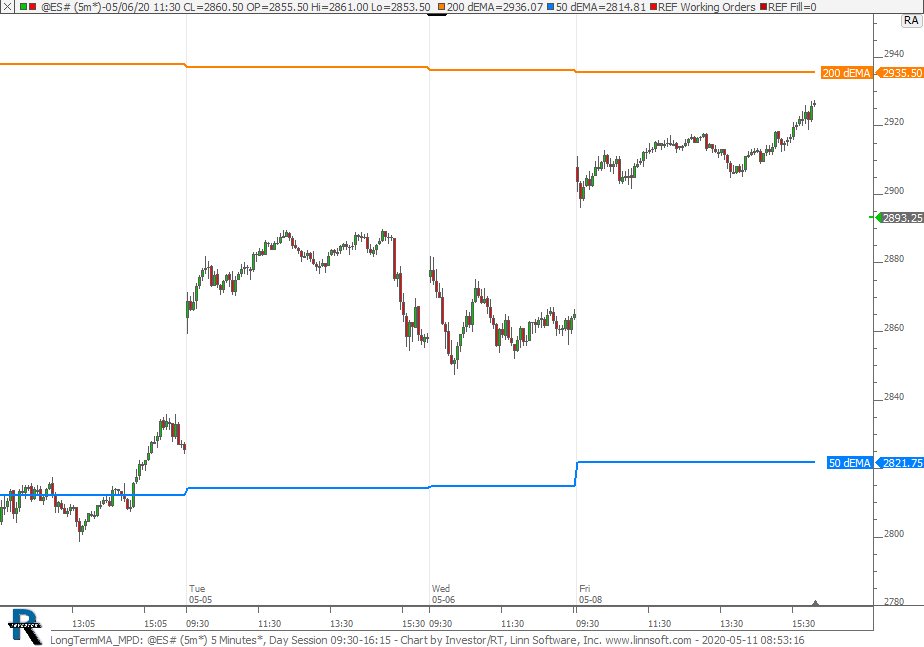 |
LongTermMA MPD (@ES#) cpayne [totalcount]
6 years 2 months ago
Longer Term - Daily 50 and 200 EMA on Intraday Chart. This chart was uploaded by Investor/RT 14.1.7 showing symbol: @ES#. |
View |
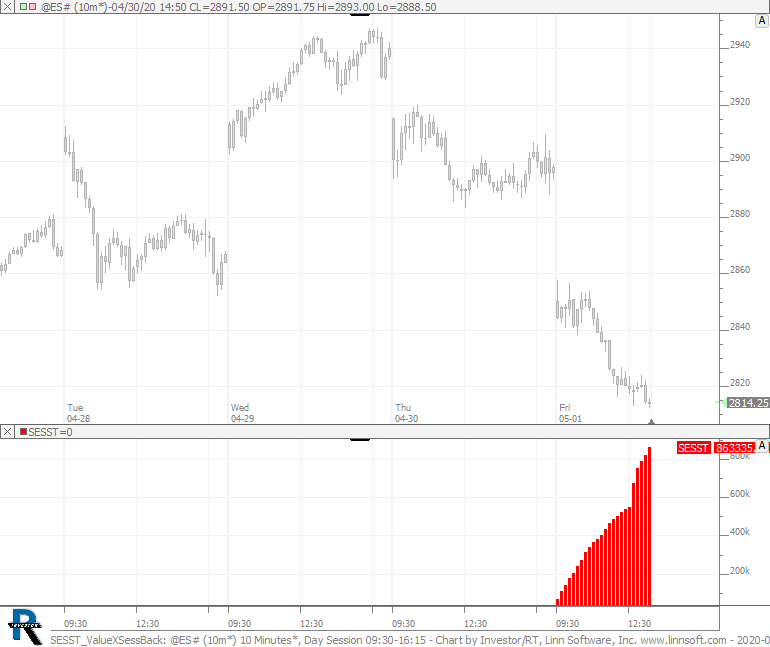 |
SESST ValueXSessBack (@ES#) cpayne [totalcount]
6 years 2 months ago
This chart was uploaded by Investor/RT 14.1.6 showing symbol: @ES#. |
View |
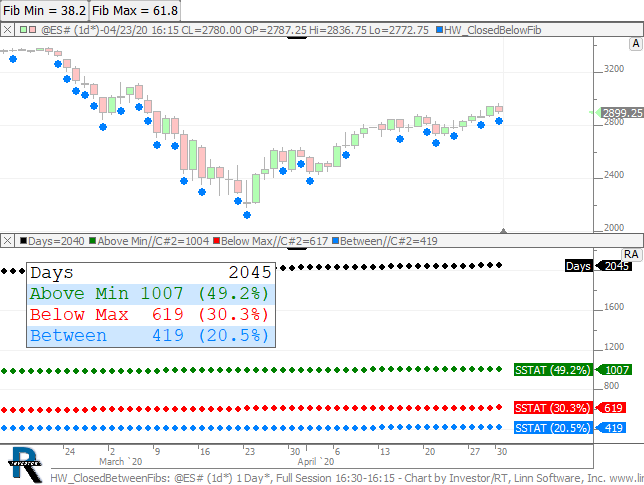 |
HW ClosedBetweenFibs (@ES#) cpayne [totalcount]
6 years 2 months ago
Close Between Fib Levels. This chart was uploaded by Investor/RT 14.1.6 showing symbol: @ES#. |
View |